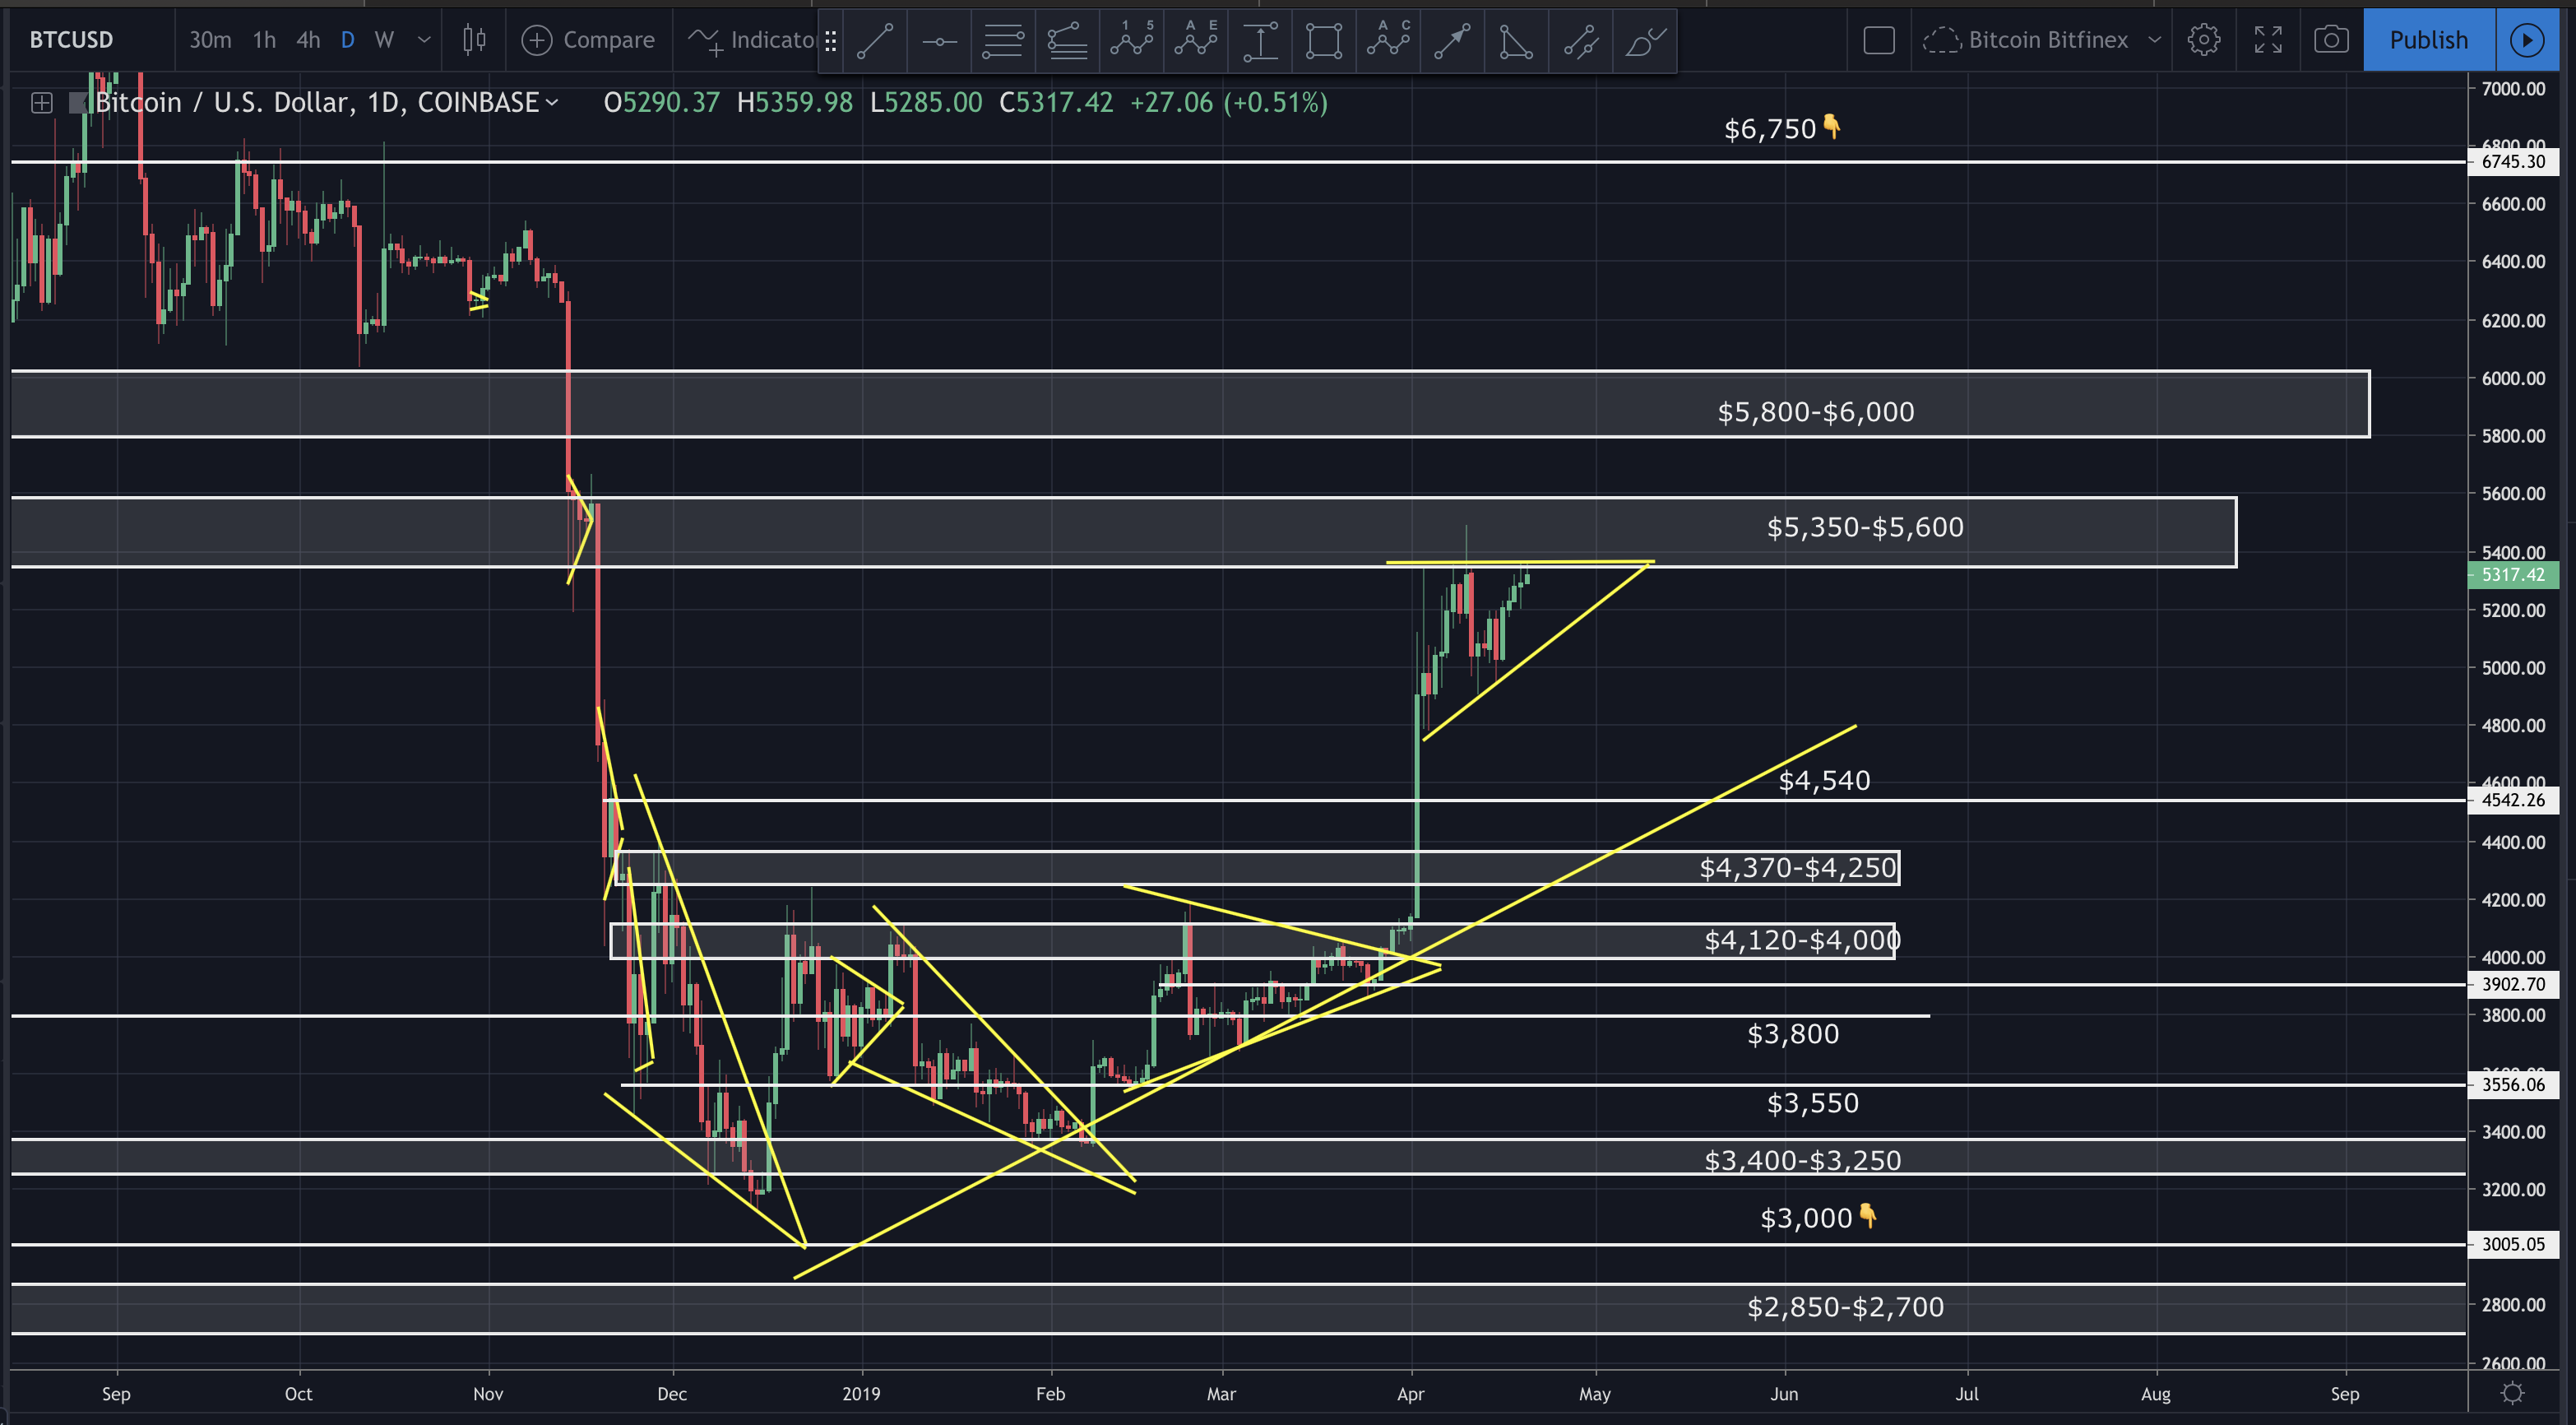
Bitcoin is once again testing the top of what appears to be a bullish ascending triangle. In my last update we discussed expecting resistance around $5,350. Daily volume remains relatively strong at just above $13 billion.

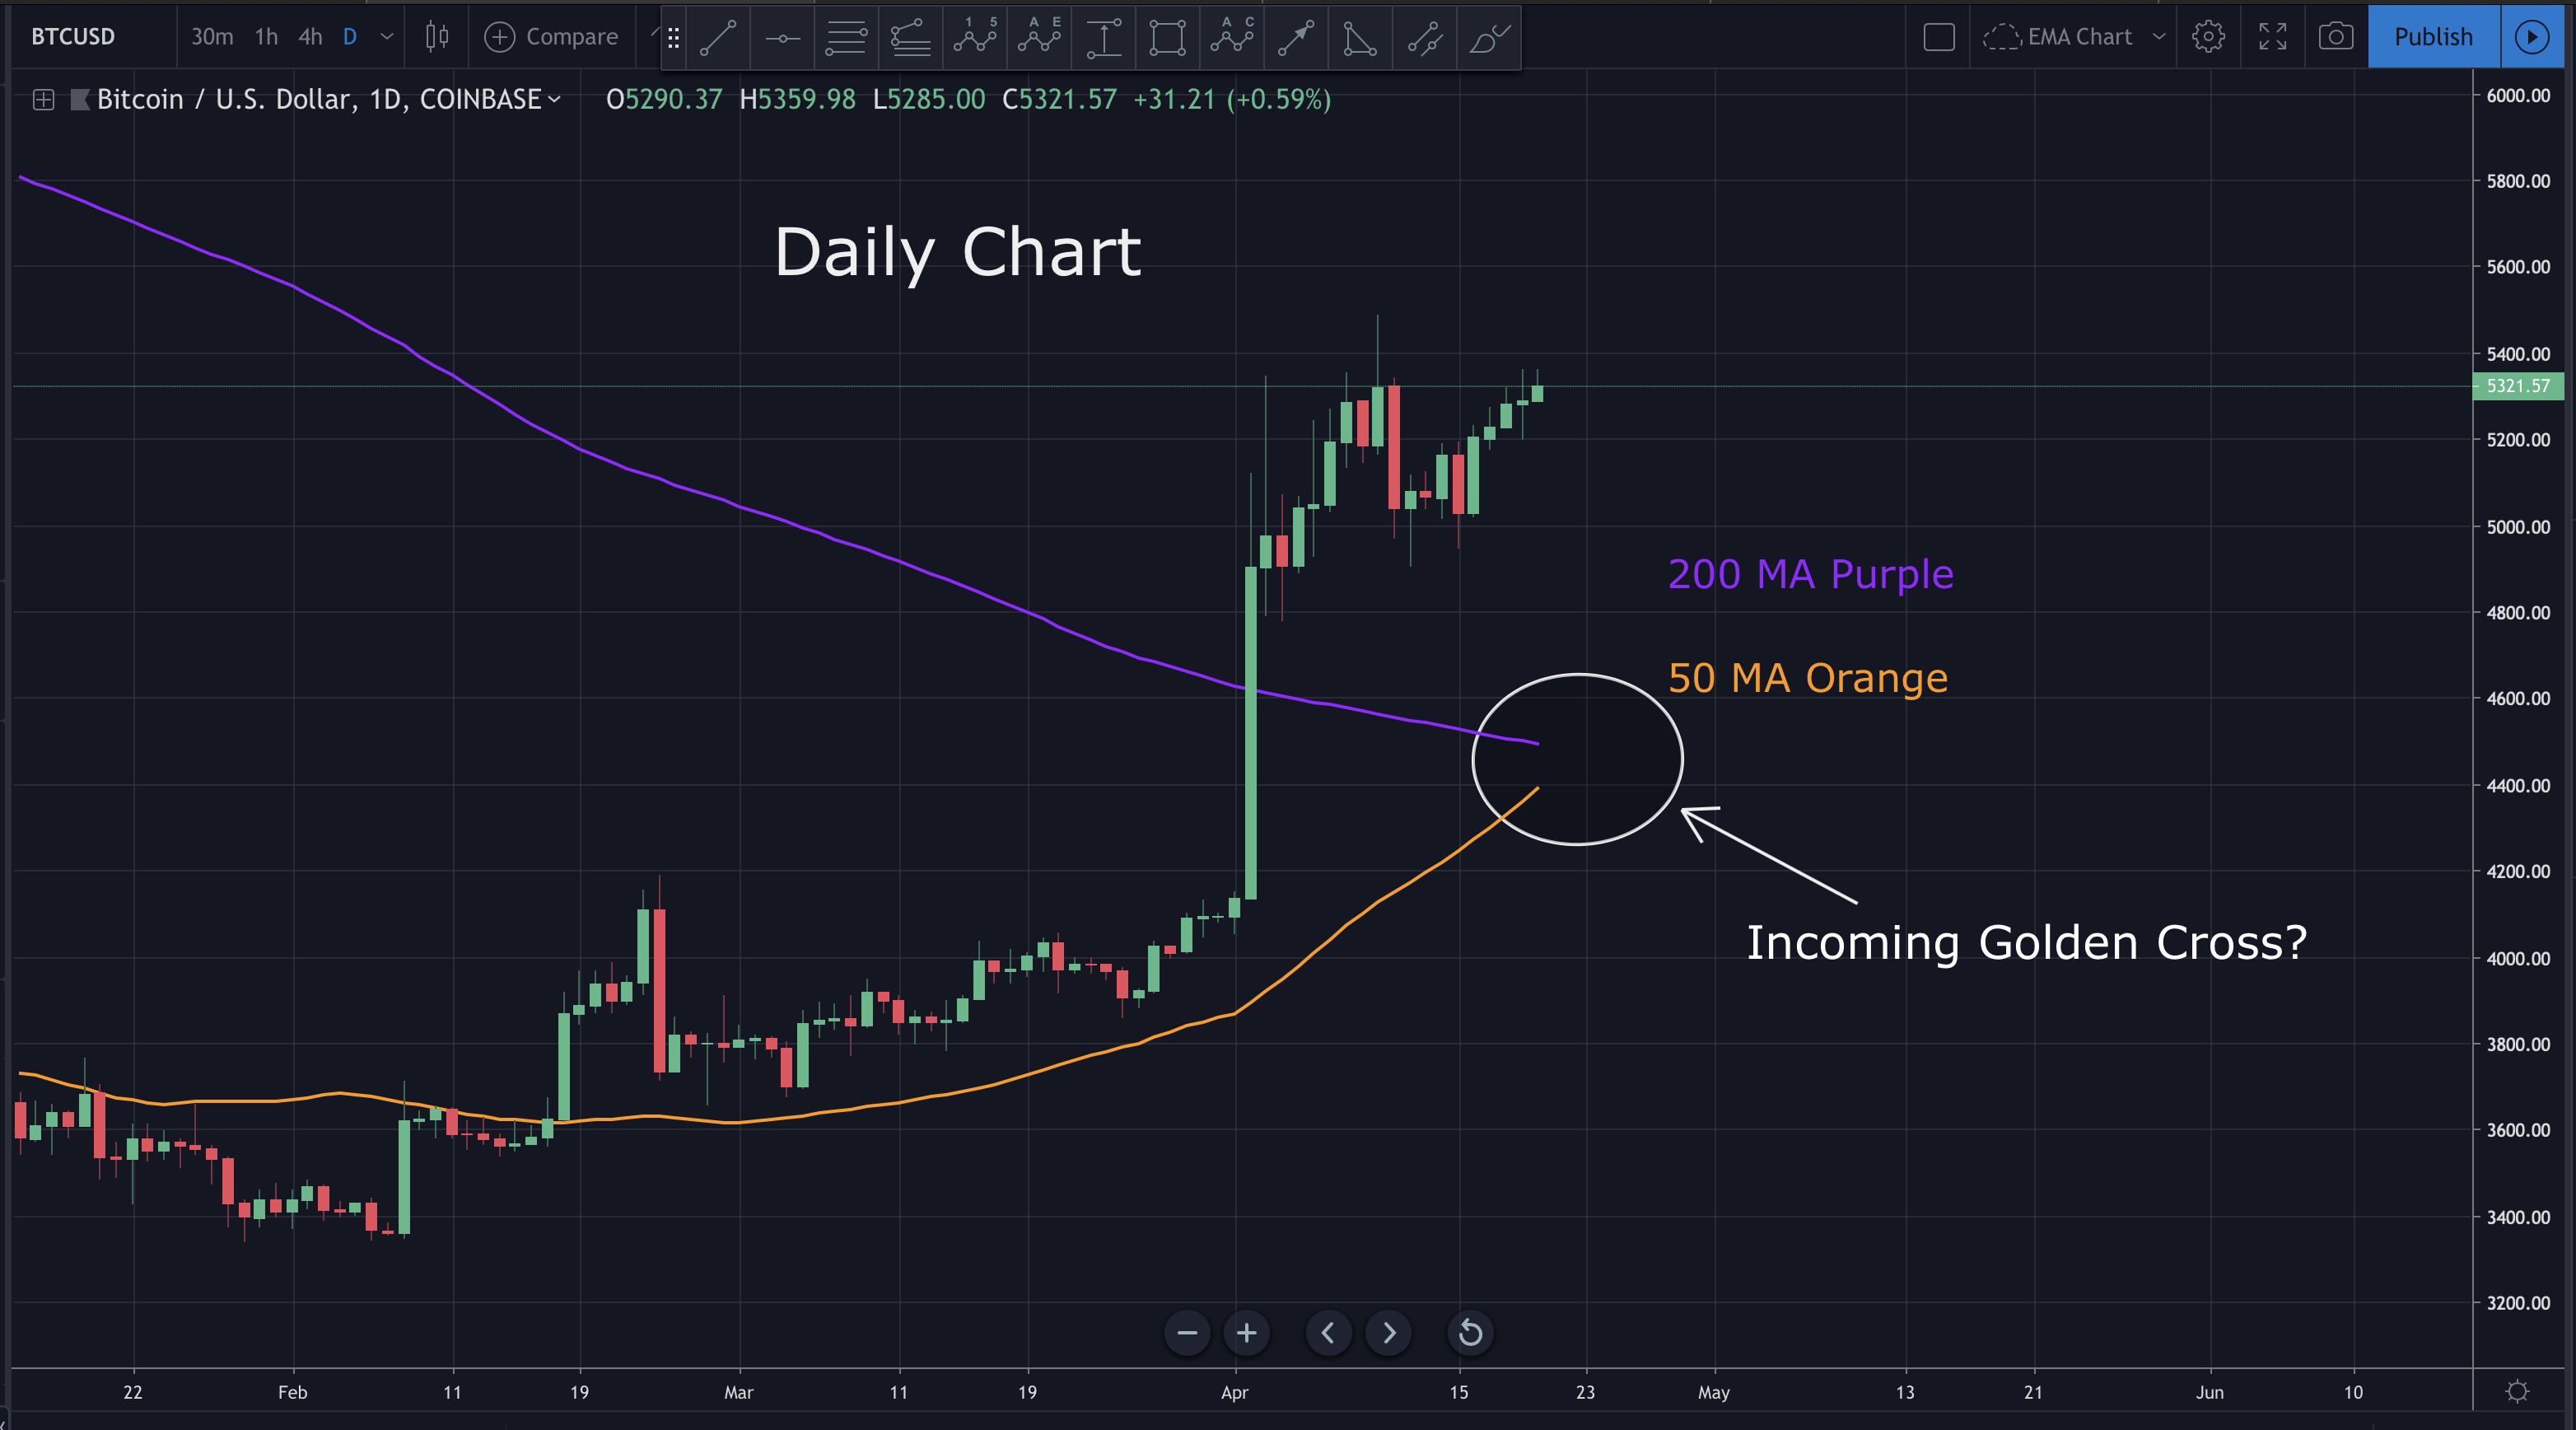
At the moment, most analysts are monitoring the 50 and 200 day MA. Will we get a Golden Cross?

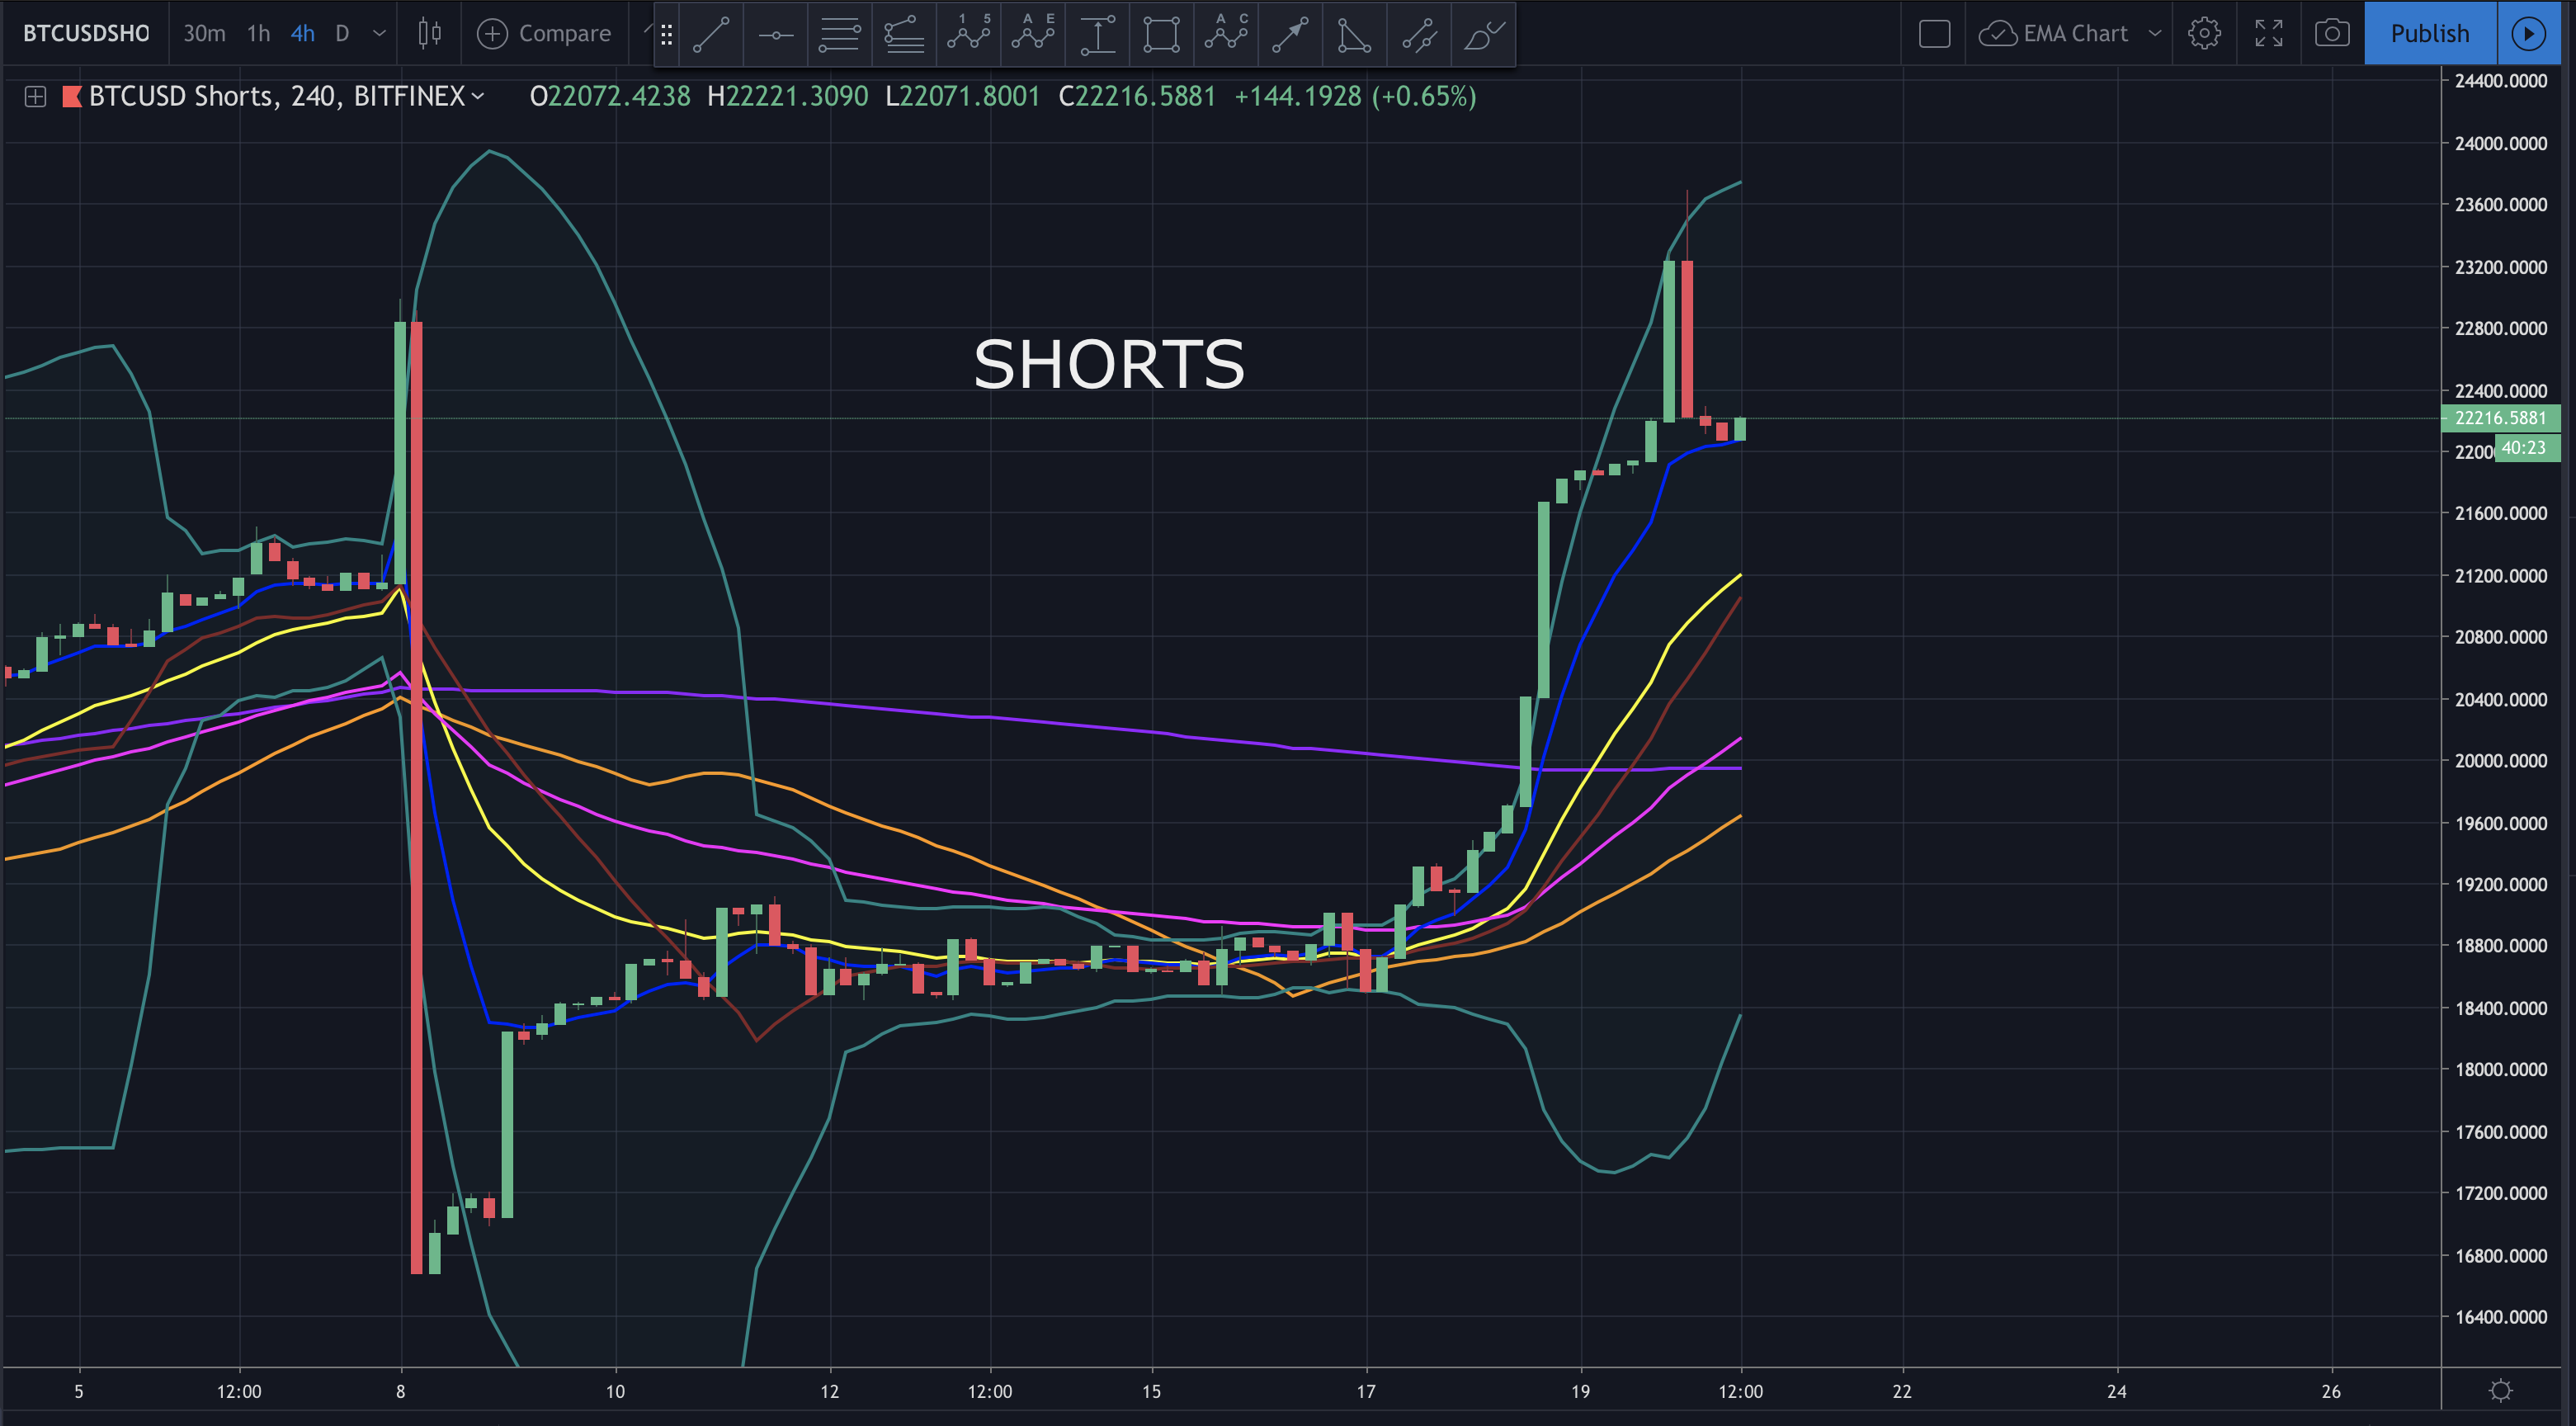
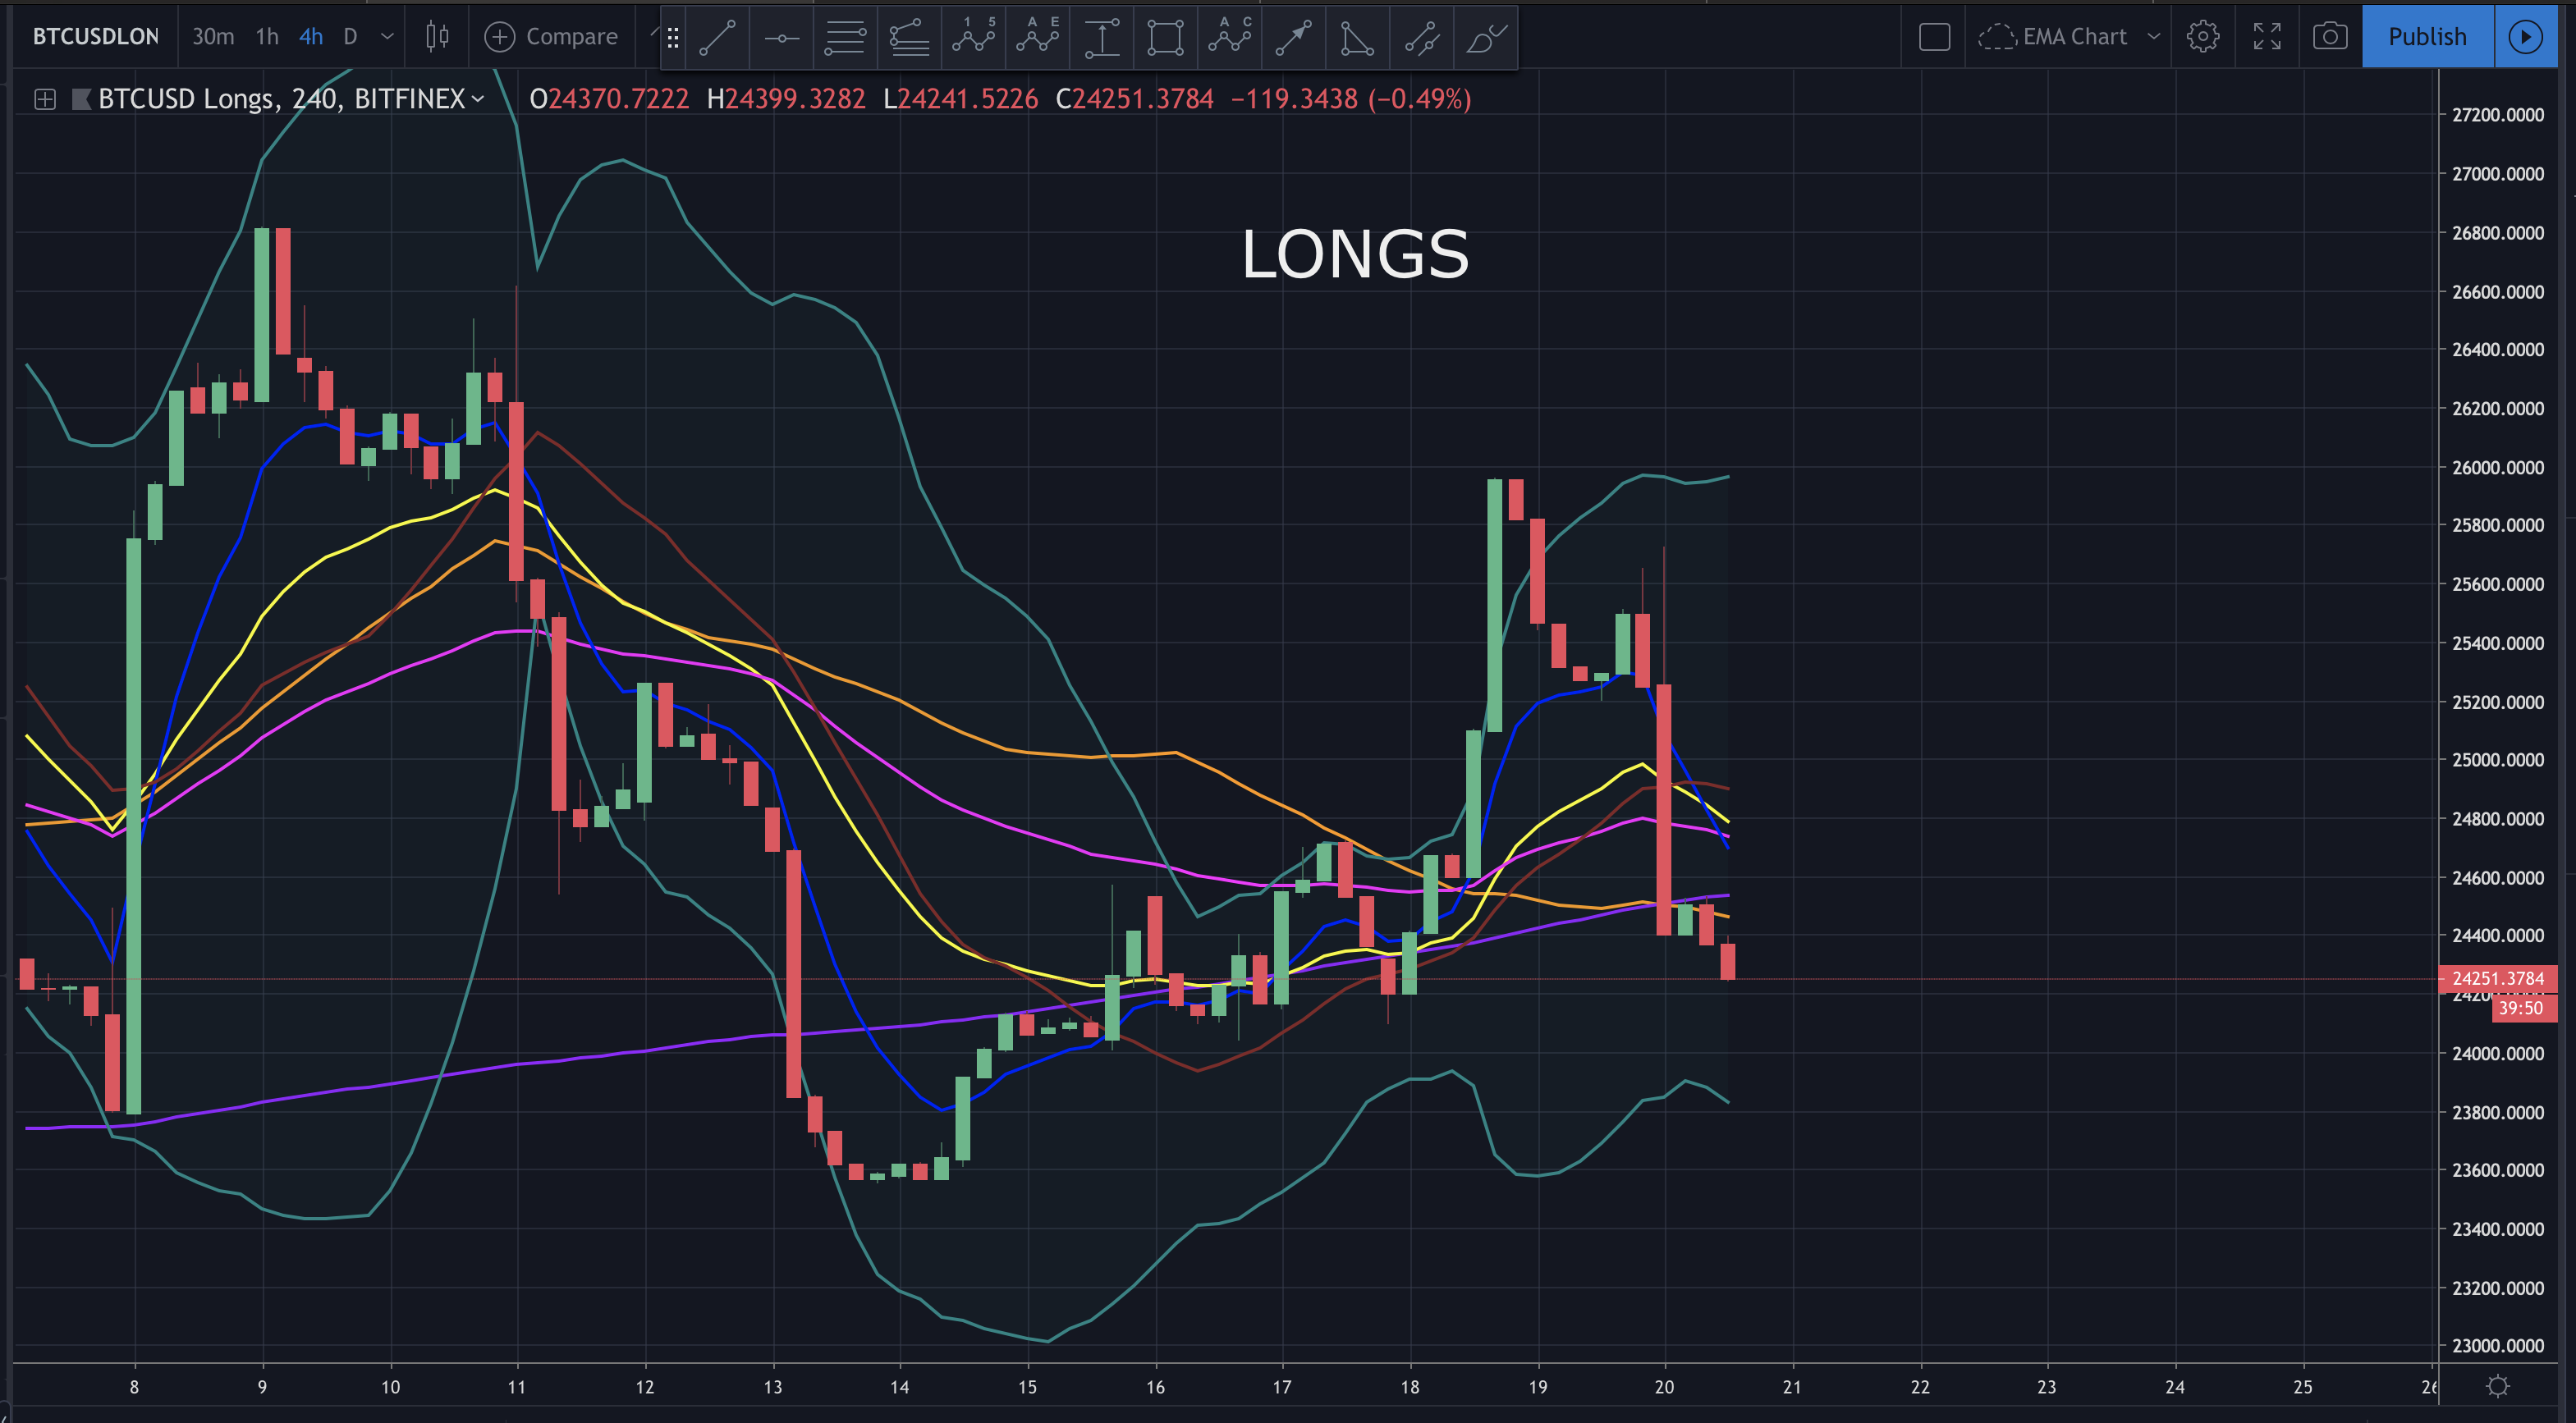
Shorts have been stacking over the last 48 hours while longs are dropping. This does suggest a break up…at least temporarily to liquidate short positions.


While things are looking good for bulls overall, the bears may not yet be done fighting.
In today’s analysis I discuss the bullish and bearish case for bitcoin. I tell you where I think price is heading in the short, medium and long term, as well as where my buy orders are waiting. We’ll also review traps to avoid and much more. I hope you find it helpful.
Video Analysis:
If you don’t see the above video, navigate to TIMM (https://mentormarket.io/workin/) or Steemit in order to watch.
I hope this has been helpful. I’d be happy to answer any questions in the comment section below. Until next time, wishing you safe and profitable trading.
Workin
If you found this post informative, please:

Open a free account on Binance here:
https://www.binance.com/?ref=16878853
Get paid for viewing ads and Support the Crypto Ecosystem with Brave Browser. Free download here:
https://brave.com/wor485
Twitter handle is @Workin2005 and Facebook is https://www.facebook.com/Workin2005
Feature Image By: Saul Gravy


Get involved!
Comments