
Yeah! the market is experimenting a substantial increase on the Trading volume. The value today, more than 11 Billion USD, is similar to the values played by the end of December 2017 and, in my opinion, this is good, very good!

After having passed one year with an average of less than 5B USD, since mid of February the trading volume has had a clear increase trend and we are now in the values we all want to see.
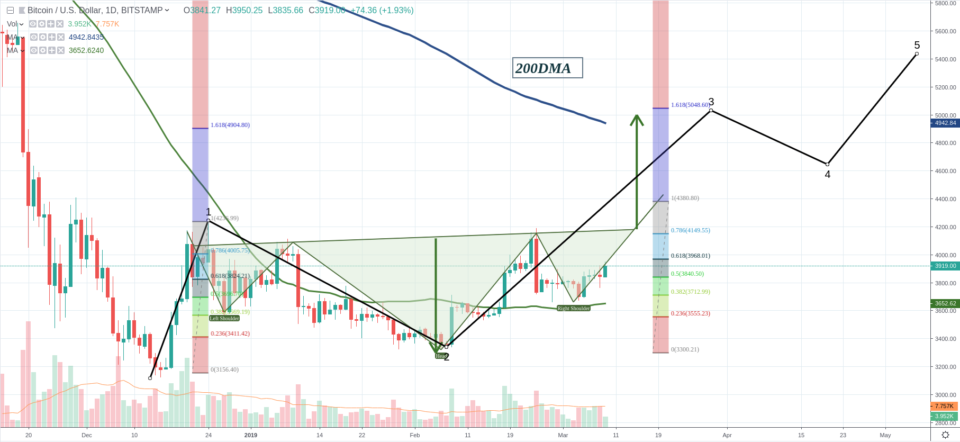
Additionally, it is obvious for any TA analyst and Pattern Recognizing user that we are entering in another interesting area which would clarify us much better if we have clearly finished the BEARISH market or if, by the contrary, more falls will come…
The Daily Chart right now shows the possibility of this Inverted Head and Shoulder Pattern:

The “Neckline” of this pattern is marking 4200 USD as the “decision” point. If BTC manages to break that level, I would expect a “free” rise of BTC towards the 200 Day Moving Average, around 4900 USD, which is the level projected if the iHS would be finally triggered.
This target is well aligned with the objective for the 3rd wave in black of the following EW Count that you can see in the below chart:

However, as I said, the “Decision” level is 4200 USD, if BTC does not manage to break that price the appearing scenario calls for a Triple Top, Which consequences are exactly the opposite :-(…
In my opinion, the chances to be in the first scenario, the Bullish one, are higher than the second, perhaps 60% against 40% due to this solid increase on the Trading Volume and also because the 50 Day Moving average seems acting as a good support, nonetheless it is good to have “one foot ” in the second one.
Enjoy!
@toofasteddie
*Disclaimer: This is just my personal point of view, please, do your own assessment and act consequently. Neither this post nor myself is responsible of any of your profit/losses obtained as a result of this information.
1 comment
Get involved!
Comments