
You should be. It is a possibility.
But fear not, because the news is not all bad! Despite current market conditions, the outlook is actually rather rosy, as I will now explain.
But before I get into that…
Short rant on a side issue:
Much to my annoyance and inconvenience, I have found myself blocked from Twitter for the past couple of weeks. This severely hampers my ability to stay in touch with the crypto community. If you have tried to contact me on Twitter, please don’t think I’m ignoring you, I’m literally unable to login.
This happened because I told an obvious scammer – one of those which Twitter is absolutely littered with – to “f*** off and die” (without using asterisks). Despite my appeal, Twitter, in its infinite wisdom, has decided to protect the scammer, and also decided that I am a threat to the community because I “engaged in abuse and harassment” by “wishing or hoping that someone experiences physical harm”. The irony of Twitter defending the real abuser is almost as hysterical as their inability to comprehend figurative speech or to spot sarcasm…
As things stand now, there is no way for me to regain control of my account without providing my telephone number to Twitter – which I absolutely refuse to do (and which is contrary to Twitter’s own Terms of Service!). I will keep trying to get back in to Twitter SOMEHOW, but until then (or in case I never do), please feel free to contact me via email at bit.brain@mailfence.com if you need/want to chat about something.
Also – feel free to tell Twitter what utter ****s they are being. I have pointed out to them that issues like this are the cause of Elon wanting to shake things up in the way they do business – which probably did not help my case in the eyes of those who work there. I don’t like having to label people “libtards”, but sometimes there is just no way around that!

Final word on this: whatever happens, I’m glad that I stuck to my guns. One should never compromise one’s values for the sake of convenience or personal gain. Hey Twitter! F*** off and die!
Bitcoin
Right, let’s talk about Bitcoin.
First up, is that $10k just clickbait or is it a threat real?
It’s a real threat.
But…
Like most things in crypto, it’s merely one possibility of several. Having said that, there is a historical precedent and other TA behind me throwing that number out there. In both of the previous modern Bitcoin bear markets, the price of BTC dropped approximately 85% from the peak of the bull market to the bottom of the bear market trough.
Since our most recent peak was around $69k (November 2021), it stands to reason that an 85% drop would place the price of BTC in the vicinity of $10k.
Now please remember: I’m not giving you trading advice, I’m merely stating what’s happened before and what may happen again. Past market behaviour is no guarantee of future market performance!
… and contrary to that (just to confuse you a little further), remember Bit Brain’s Fourth Law of Crypto: “Technical Analysis is a graphical representation of market psychology. It is a way to visualise the feelings of masses of people wrt trading.” Since the macro-level psychology of human beings does not evolve measurably within a human lifetime, one CAN use such behaviour to infer the future from the past – if done carefully and acknowledging the limitations thereof.
What else does the future hold?
Acknowledging that my crystal ball is cloudy at best, let’s look at the relevant TA.
I suppose I could still use the arrow from by previously published Bitcoin charts, the one that looked like this:

But since BTC has now dropped well below the ranges I was basing that arrow upon, continuing to use it would be akin to PlanB’s (unethical and of no practical value) ultra-wide and all-encompassing channel. I have no desire to willingly commit such logical fallacies, however popular they may be. (Shots fired)
So out the window goes the old arrow, and in comes… what?
Well – it starts with the possibility of that $10k dip, but after that, things start to look up.
Once again: history teaches up that capitulation dips are sharp and short, so I wouldn’t expect BTC to dwell in the $10k region for any appreciable amount of time. I WOULD expect BTC to move sideways for a few months (maybe 3 to 6 months) after the capitulation dip, but that’s only after a price recovery of a good few thousand USD.
After the dip and the sideways period, that’s where the “rosy” part of this post comes into play.
You see, at the moment, BTC is oversold. Not just a little oversold, but CHRONICALLY oversold. And if that’s true for the $20k BTC of today, then it’s doubly true for any $10k BTC which we may see.
I’m sure I don’t have to explain that “chronically oversold” represents a great buying opportunity. I also hope that I don’t have to explain that nobody hits the very bottom of a dip, and that it’s better to get in (or out) at a very good price, than to hold out for an even better price that never comes. (Tip: when in doubt – use short-term DCA.) It’s entirely possible that we’ve already seen the bottom of this dip, but I warn you against counting on that!
Okay fine, it’s all very well that Bit Brain says “now is a good time to buy”, but how do we know this? What evidence is there to support this from a TA standpoint?
The evidence
I apologise in advance that I won’t be able to show you most of the charts for this section. That’s only because their creator does not permit their use in such a manner, BUT, you CAN use the links I’ve provided to see them for yourselves. I strongly suggest that you do use the links, they are very good charts and I find them to be extremely useful (even if I fail to take action when they suggest!).
For this section I will briefly discuss each chart/indicator one at a time. It would be best if you open that chart in another browser tab and view it while reading this post.
Let’s start with something I can show you. The chart below is one which my regular readers should be very familiar with by now. I have long stood by my long-term base trendline for BTC, represented on this chart by the line at the bottom of the channel. To me this line represents the base price of BTC over time, in other words, it is the price of BTC in a market completely devoid of hype. I tweak it ever so slightly every few months, but generally the line remains exceptionally constant.

The critical thing to notice is that the price of BTC is already well below the long-term base trendline (it’s falling out of the bottom of the channel). This is our first strong “chronically oversold” indicator. Looking at the chart above, you can see how rarely this line is crossed. Previously it happened only in late 2015 and during the initial 2020 Covid market crash. (For those concerned about the very beginning of this chart: I have already written several times about why I don’t apply TA to crypto data which predates mid-2013. Short version: it’s overly volatile; mainly due to low liquidity, and can be safely ignored.)
The second thing to notice about this chart is the 200 week MA line which I have inserted. Much like my long-term base trendline, this indicator provides another base to the price of BTC which is very seldom crossed. As you can see, the current dip is the greatest breach of this MA to date. This reinforces the “chronically oversold” narrative. Now let’s see what the charts of others can show us.
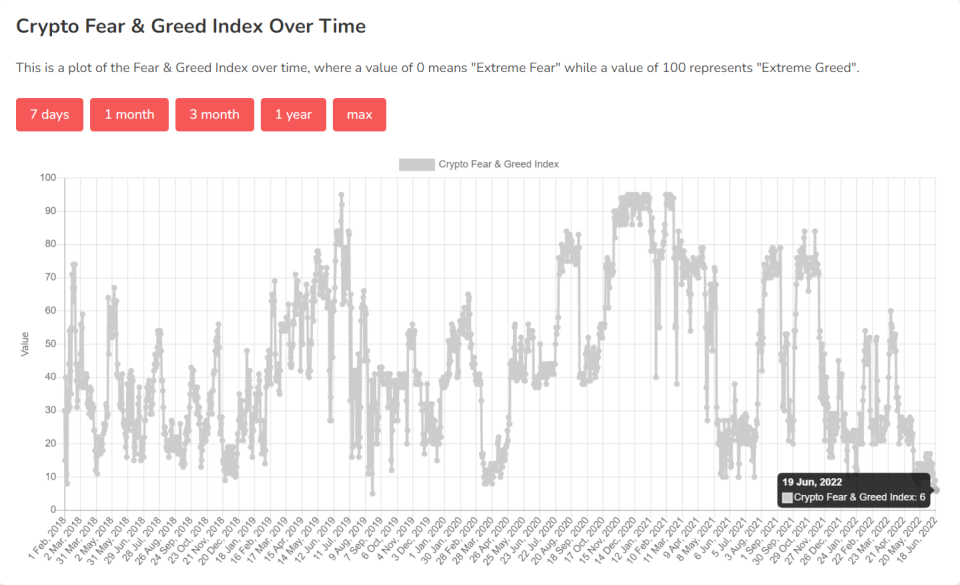
First up is the Crypto Fear and Greed Index. (thank you to the creators of this chart for making their work shareable in the public domain!) You can find this chart and more information about it at https://alternative.me/crypto/fear-and-greed-index/

We are now at “6” on this index. A value of 6 (out of 100) is about as bad at the Crypto Fear and Greed Index has ever been. Look at the chart, in its entire history (since 1 February 2018), such a value has only ever been encountered once before. Even the Covid panic did not succeed in pushing this index so far into “Fear” territory!
A nice thing about this index is that it is not entirely derived from the trading action of BTC. While price movement, volume and derivations thereof form the basis of the index, it takes into account other factors such as Social Media and Google Trends. For more info on it, visit the link above.
Lookintobitcoin
The following TA charts can all be found on “lookintobitcoin”. I have spoken about this excellent resource before. By way of example: their Pi Cycle Top Indicator has called the market top correctly on all three occasions since mid-2013, and even the early 2013 market top too. When it flashed a market top signal at $60k last year, I thought it was a false positive and ignored it. Yes, BTC DID rise a little higher in Q4 2021, but to repeat my words from earlier: “… nobody hits the very bottom of a dip, and that it’s better to get in (or out) at a very good price, than to hold out for an even better price that never comes.” Ignoring my own advice is one of my greatest weaknesses. Moving along…
If you’re relatively new to crypto or inexperienced wrt TA, then this is the chart for you (more experienced readers may wish to skip this paragraph). Here is the Bitcoin Rainbow Price Chart Indicator. While I’m not a fan of applying logarithmic regression to BTC curves (also explained at length in older posts of mine – it’s simply an unsustainable metric in the long-term), this indicator does provide a simple “Dummies guide” of when to buy and sell BTC. That we have now dropped from “BUY!” into “Fire Sale!” territory should be a clear indicator to anyone of just how ridiculously cheap BTC is by today’s standards. As with the previous indicators mentioned, a “Fire Sale!” on this chart is a rare occurrence and indicative of a large and profitable rise in the medium to long-term future.
The Puell Multiple is also flashing well into the green. While not a perfect metric (because it fails to account for transaction fees), the Puell Multiple calculates the daily value of newly mined Bitcoins divided by that same value averaged over the last 365 days. The value of this index is that it shows the amount of new Bitcoin entering the market relative to what that figure normally is. So, for instance, a Puell Mulltiple of 0.5 means that only half as much Bitcoin (in USD) entered the market compared to the average for the last year. Miners who can afford to should hold onto their coins when the Puell Mulltiple is low, knowing that they will get better prices when the market normalises later on. At a value of 3.5 the Puell Multiple goes into the red – indicating that miners are earning way more than normal for the period. This suggests that price may drop. At a value of 0.5, the Puell Multiple goes into the green, indicating that the price of Bitcoin is abnormally low. This indicator has only been in the green for five different periods since mid-2013, the current period being the fifth.
MVRV Z-Score is an indicator designed for times like this: periods when Bitcoin is (in the words of lookintobitcoin) “extremely under or overvalued”. MVRV Z-score is determined by subtracting the Realised Cap of BTC from the Market Cap of BTC and then dividing by the Market Cap Standard Deviation. If that sounds like gobbledygook , then just bear with me, I’ll explain it.
Market cap is easy, you’re probably already familiar with it: Market cap is the total value of all coins in circulation, calculated as “total number of bitcoins minted X price of bitcoin right now”. Realised Cap is a bit trickier. Realised Cap (there is a separate chart for it too if you are interested) is a very useful metric. What it is is a measure of the value PAID for all bitcoins in circulation. In other words, Realised Cap ignores current price. What it does instead is to ask “what is the average price that people paid for all the bitcoin in circulation today?”, and then it multiplies that price by the number of bitcoins minted in total (just like Market Cap does). To approximate the average price paid, the average price is calculated from the last time that any and every bitcoin (or part thereof) was moved to a new address (implying that it may well have just changed ownership). It’s not perfect, but it’s a good enough approximation. The Standard Deviation part of the equation merely smooths the data out by norming spikes in the data to statistical averages.
By subtracting Realised Cap from Market Cap, one gets a ratio of what everyone paid for their Bitcoin relative to what it’s all worth today – in total. So if that ratio is negative, then people have made a nett loss on their purchases and are unlikely to sell. That ratio currently sits at -0.25, meaning that on average people have lost money on their investment. Provided that they are not desperate enough to capitulate and sell, this implies that the average holder will not sell now, because they will make a loss if they do. Obviously not selling is bullish for Bitcoin. This is only the fourth period that the MVRV-Z Score has been negative in the last decade.
Net Unrealized Profit/Loss (NUPL) is very similar to MVRV Z-Score in terms of its calculation and meaning. For what it’s worth, this indicator started flashing “Capitulation” a week ago.
RHODL Ratio shows the age of coins in the market. “Age” is probably not the right word, but I’m going to use it anyway. What the ratio actually measures is how long coins have been sitting in people’s wallets. I’m going to spare you the maths lesson on this one (you can always read up about it on your own), instead I’ll just sum it up thusly: the age of newer coins (coins which have only been sitting in a wallet for a short time) is compared to the age of older coins. We find that when the price of BTC is at its peak, most of the value of BTC lies in newer coins. When the price of BTC is low, most of the value is in older coins, those that have been lying in wallets for a long time. Right now the RHODL ratio is low and dropping. It should be noted that there is indeed space for it to drop further, and that in the past, it has dropped well below the current value towards the end of bear markets. This may well mean that the $10k possibility I mentioned is more of a probability, but again, technical indicators are only a guide, take them with a pinch of salt. I believe that the important take-away from this metric is that most of the newer “weaker” hands have now sold and that that BTC is now sitting in the wiser and more experienced hands. As we stand now, this indicator is potentially bearish in the short-term, but bullish in the medium and long-terms.
Finally, let’s take a look at the larger BTC wallets and what they are up to.
Wallets of between 1 – 10 BTC have absolutely taken off over the last week. About 10 000 new 1+ BTC wallets were created this last week! If I had to guess, I would say that this means smart retail investors are buying while they can afford to. I think this is a wonderful opportunity for them to do so and I’m certain that it will pay off for them.
Wallets of between 10-100 BTC have picked up slightly over the last few days, but not significantly so. I suppose that this amount is well beyond the reach of most retail investors, even in a dip like this.
Wallets of between 100-1000 BTC have remained even flatter than the 10-100 BTC category. This is to be expected. Well into whale and institutional investor territory, such wallets are unlikely to sell in a weak market, and are perhaps hesitant to stock up too much now, thereby overloading their portfolios with an asset that mainstream finance still considers to be risky.
The Wallets of 1000+ BTC category is the most interesting to me. Numbering a little over 2000, these super-whales have been surprisingly active! After peaking in number in February of 2021, they started selling off – well over 250 000 BTC in total – in the early half of last year. After this profit taking, which may well have stalled the BTC rally at the time, they sat stagnant for several months. Then at the end of February this year, about 150 new 1000+ BTC wallets suddenly sprang into being. This move was unprecedented: we haven’t seen anything that sudden and large in BTC – ever. Whether it coincided with the end of someone’s tax year or the expiration of some large futures contracts or something, I don’t know, but it was one for the record books. Since mid-March the whales have been decreasing in number, an especially strange move considering that they carried on selling after April – at which stage any of those 150 new accounts would have been selling at a loss. The super-whales continue to sell very slowly.
Looking holistically, I’m very pleased with what I see. Super-whales have dropped to similar numbers to what they were at three years ago. From a decentralisation standpoint, this is very good and healthy. At the same time, the 1-10 BTC accounts are buying like mad, another huge win for decentralisation. And if those accounts are buying, then I’m hoping that the <1 BTC accounts are also stacking sats like mad. BTC wealth seems to be transferring from whales to minnows, which is great! Obviously I’m making sweeping generalisations and assumptions here, for instance: a 1000 BTC whale could theoretically have transferred 1 BTC to 1000 different new wallets which he created himself, but such scenarios are uncommon and unlikely. It looks like the selling pressure is dying off now, which suggests that this drop/capitulation event may be nearing it’s end.
In the Greater Scheme of Things.
Wow. Where to start?
The Fundamental Analysis behind this topic is so vast that I could literally write about it for weeks on end.
It seems to me as if all our so-called “doom & gloom” prophesies are finally being proven right. And by that I don’t mean crypto doom and gloom, I mean the greater economic markets of the world doom and gloom. Apart from the Terra incident, crypto itself hasn’t done anything “wrong” recently, the drop we see in crypto at the moment is not a crypto drop per se, it’s an indication of the extreme fear in the global economic markets. In simple terms: the economy of the whole world is falling apart. Sadly, crypto is still seen as “speculative” and has thus far failed to decouple itself from the fiat markets. Thus when global markets drop, crypto drops – hard!
I’m not going to go into the nuts and bolts of what is happening in the world, that topic is simply too big to elaborate on in this post. If you want to know more, then hunt around on (good!) YouTube channels or blogs. Check out what people like Robert Kiyosaki are saying (and have been saying for years). I recommend watching a guy on YouTube called The Economic Ninja, he’s probably about 10% too conspiracy theory for my liking, but he’s got loads of common sense, a solid knowledge base and really great down-to-Earth way of sharing information – which he does several times a day.
It’s too early to say if this if the great economic meltdown which many of us have been predicting for so long, but it may well be. The stagflation I’ve warned about for years is here, the inflation may well become the hyperinflation I’ve warned about. Economic output is down, currencies have been debased, inflation is high, interest rates have hit the floor, unemployment has spiked etc etc…
Of course you’re free to believe the mainstream narrative that A, B, C… are “transitory” or “under control” or “no longer a problem” – but you do so at your own peril and against my advice. Employment is NOT fixed – they merely measure it differently, (rapidly) rising interest rates are NOT going to save us (they’ll stall already fragile economies) and all the ills we see today are NOT “caused by Russia / Ukraine”, that’s a tiny piece of the problem which is being used as a convenient scapegoat.
Extremely condensed prediction: I think the rapidly rising interest rates (necessary to prevent runaway inflation) will stall the economies further. The economies are too fragile to handle that and everything will start to crash (more). When the “too big to fail” companies start to look shaky, governments will reverse the interest rate decisions – lowering them to encourage spending. Inflation will still be out of control when they do so. By then the middle class will already be in serious economic trouble – having seen their debts balloon (thanks to the interest rate rises), meaning that they will have spent less and defaulted on debt (which hurts the very wealthy and has other knock-on effects). To further try to boost the economies back into life, the governments will spend like crazy (AGAIN!), trying to save the stock market through artificial stimulus (growing the wealth gap to new highs in the process). This cash injection will have the usual effect – the rich will hoard it and the theoretical “trickle down” to the middle class and poor will not materialise (as usual). Governments around the world are already broke and most citizens are already overtaxed (at least the middle class citizens are), so governments will have to default back to debt and money printing – the very reason we’re seeing so much inflation right now. This could well lead to hyperinflation and/or total economic collapse.
Ultimately that’s a win for Bitcoin. While adoption is not nearly where it should be yet, sooner or later the real reason behind Bitcoin’s existence will go viral. I doubt we’ll see a global awakening where fiat disappears entirely and Bitcoin suddenly frees the world of governments and bankers, but I think we’ll be able to rebuild something far more decentralised and better than we have now – even though governments and banks will try hard to fight us and deceive the masses with their CDBC rubbish. I can’t say much more without resorting to pure speculation, but I HOPE we’ll see a brighter tomorrow after whatever happens to the global economy in the near future.
Yours in crypto
Bit Brain

“The secret to success: find out where people are going and get there first”
~ Mark Twain
“Crypto does not require institutional investment to succeed; institutions require crypto investments to remain successful”
~ Bit Brain
Get involved!
Comments