

BitCapitalVendor (Huobi: BCVBTC) has broken out of the triangle pattern in the daily chart.
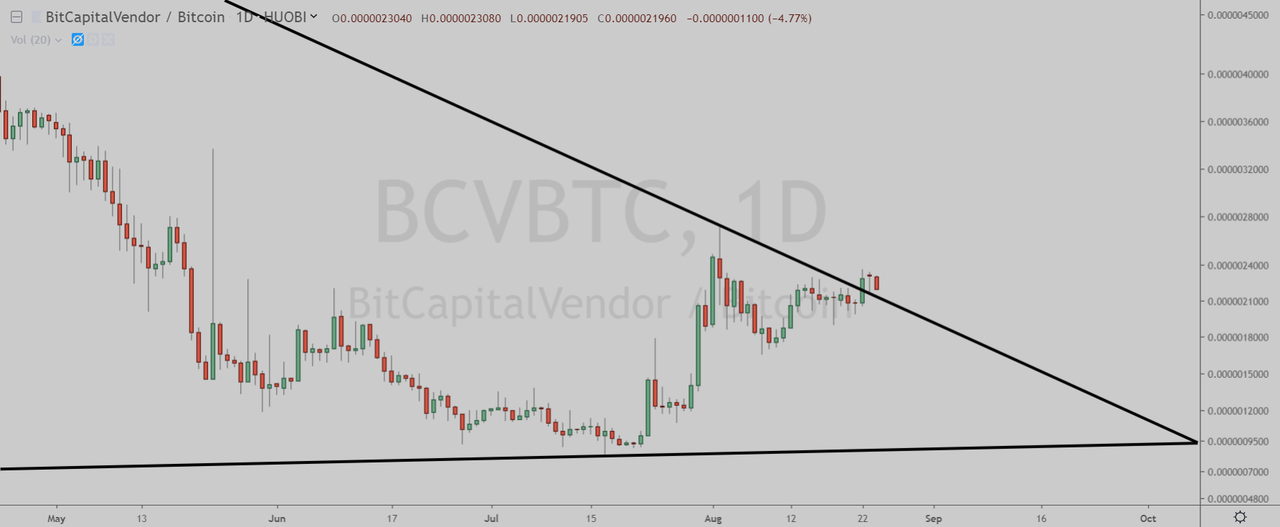
(Chart courtesy of Tradingview.com (log scale))
Elliott Wave Analysis
In Elliott Wave terms, BitCapitalVendor began a wave one advance in October 2018. The red wave one (blue sub-waves i-ii-iii-iv-v) finished in March this year, and the red wave two (blue sub-waves a-b-c) correction ended in July. If this wave count is correct, BitCapitalVendor should be heading next towards the March peak in the red wave three.

(Chart courtesy of Tradingview.com (log scale))
Funnymentals
The Bit Capital Index 30 and the Bit Capital Index 150 (known as the BCI) are a set of indexes released by Bit Capital Vendor in April 2018.
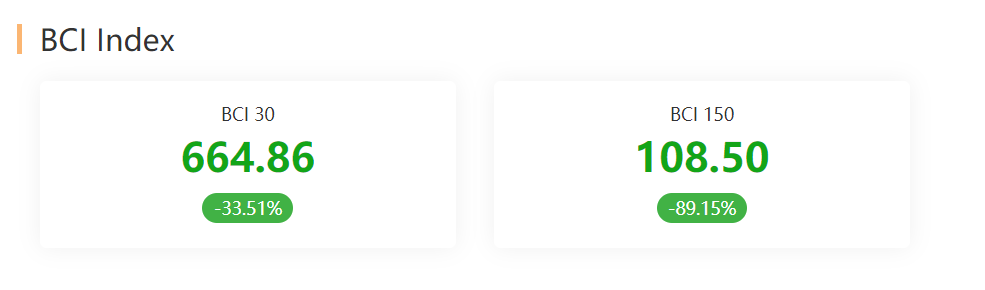
(Sources: BitCapitalVendor)

How can I vote? Where is the contest?
You can vote by following this link.
Get involved!
Comments