

MediShares (Huobi: MDSUSDT) has broken out of the triangle pattern in the daily chart.
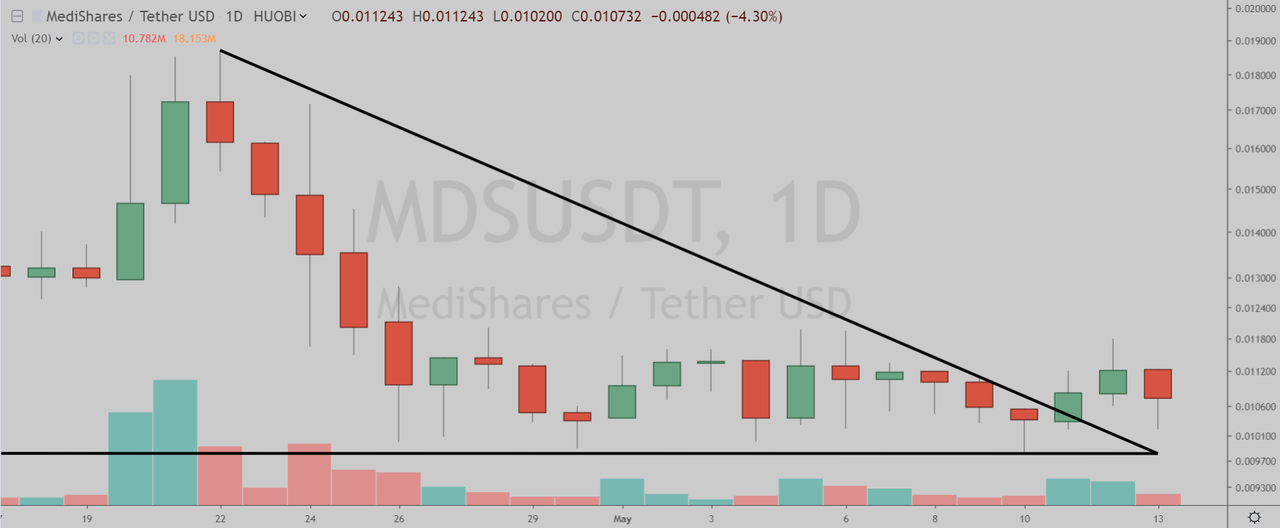
(Chart courtesy of Tradingview.com (log scale))
Elliott Wave Analysis
In Elliott Wave terms, MediShares began a wave one advance on December 15, 2018. The red wave one (blue sub-waves i-ii-iii-iv-v) finished on April 8, and the red wave two (blue sub-waves a-b-c) correction ended on May 10. If this wave count is correct, MediShares should be heading next towards the April 8 peak in the red wave three.
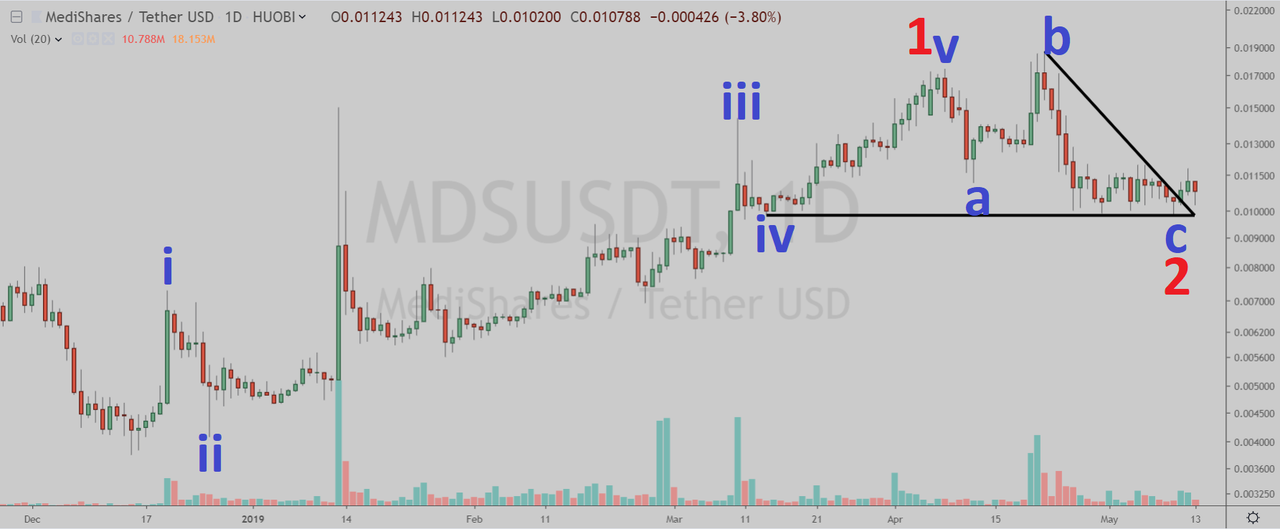
(Chart courtesy of Tradingview.com (log scale))
Funnymentals
Medishares is a Ethereum based, decentralized, open-source mutual insurance marketplace. You can read their latest project update here.
(Sources: MediShares and Blog)

How can I vote? Where is the contest?
You can vote by following this link.
Get involved!
Comments