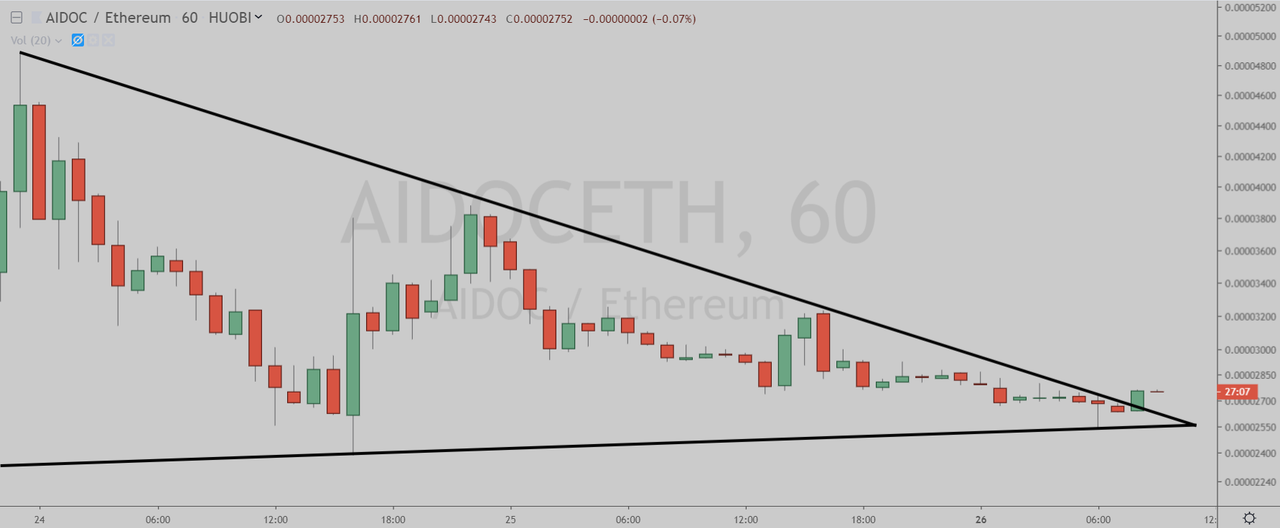
AI Doctor (Huobi: AIDOCETH) has broken out of the triangle pattern in the one-hour chart.

(Chart courtesy of Tradingview.com (log scale))
Elliott Wave Analysis
In Elliott Wave terms, AIDOC began a wave one advance on August 8. The red wave one (blue sub-waves i-ii-iii-iv-v) finished on August 24, and the red wave two (blue sub-waves a-b-c) correction ended on August 24. If this wave count is correct, AIDOC should be heading next towards the August 24 peak in the red wave three.

(Chart courtesy of Tradingview.com (log scale))
Funnymentals
AIDOC uses medical data and smart doctor AI technology to provide the user constant health and wellness insight. You can read their latest bi-weekly report from here.

(Sources: AI Doctor and Twitter)

How can I vote? Where is the contest?
You can vote by following this link.


Get involved!
Comments