
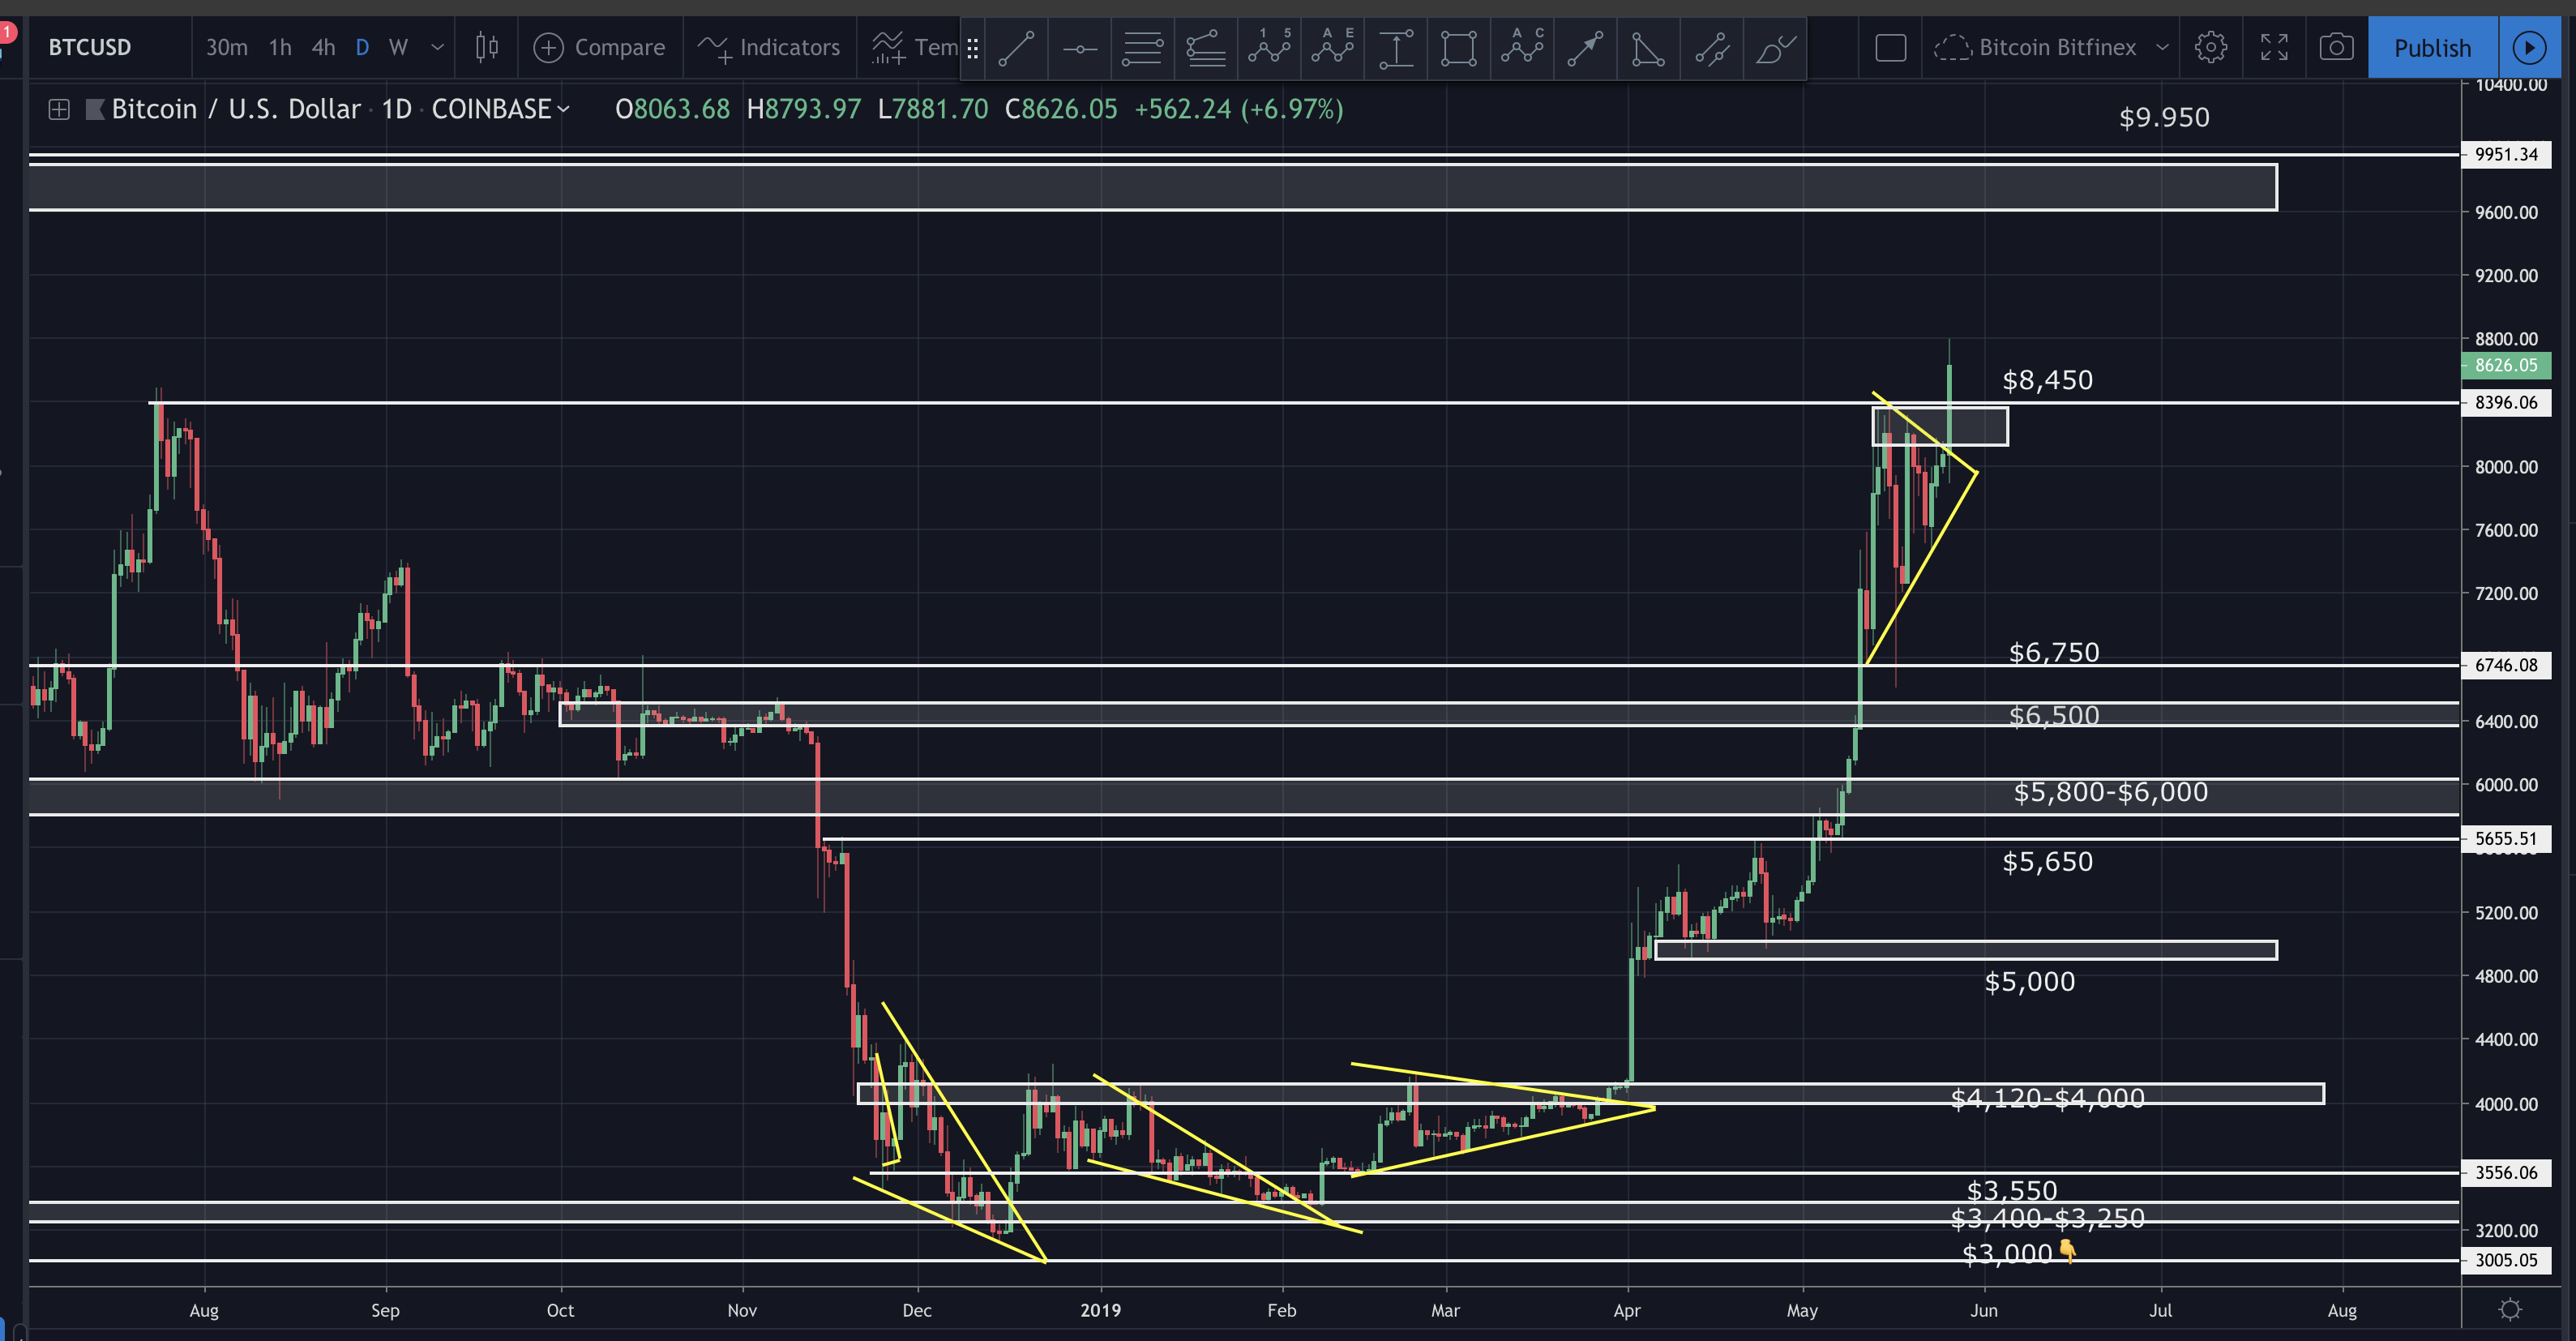
Bitcoin finally broke up and out of the wedge it’s been consolidating in over the past 2 weeks.
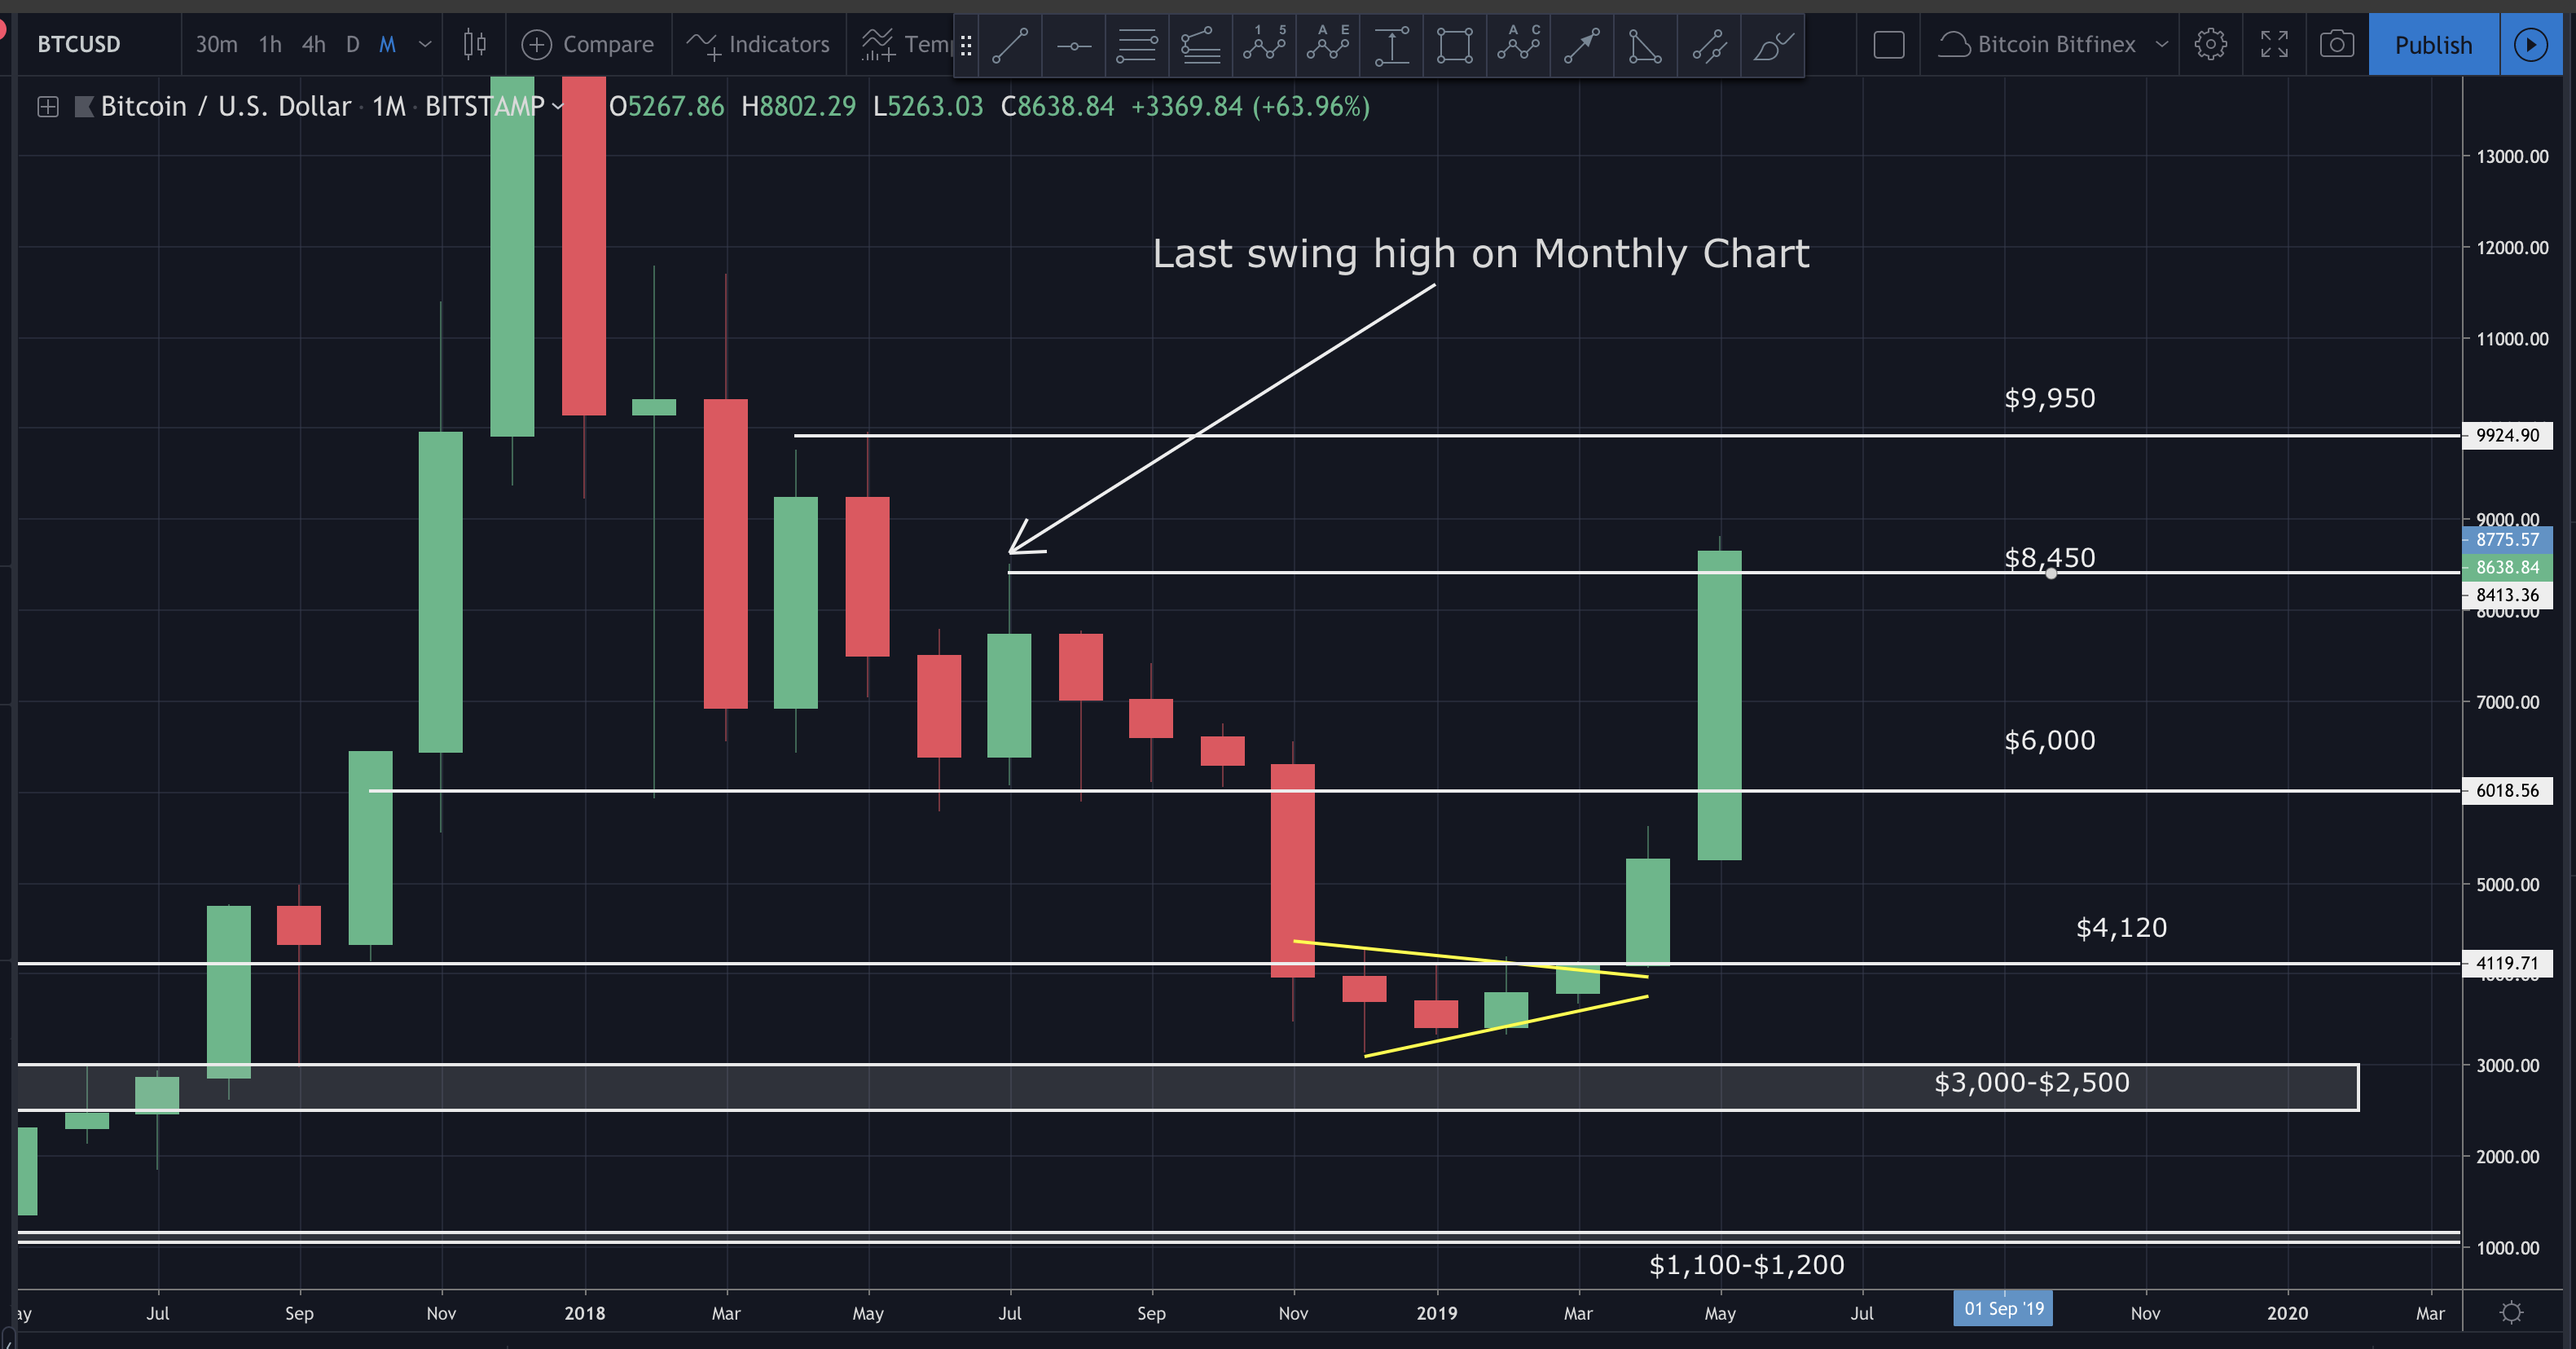
Zooming out on the monthly chart, we can see the last swing high (approximately $8,480) was created back in July of 2018. Price has now officially taken out the prior swing high (on the monthly) of the bear market. In my opinion, this confirms the bottom is in.
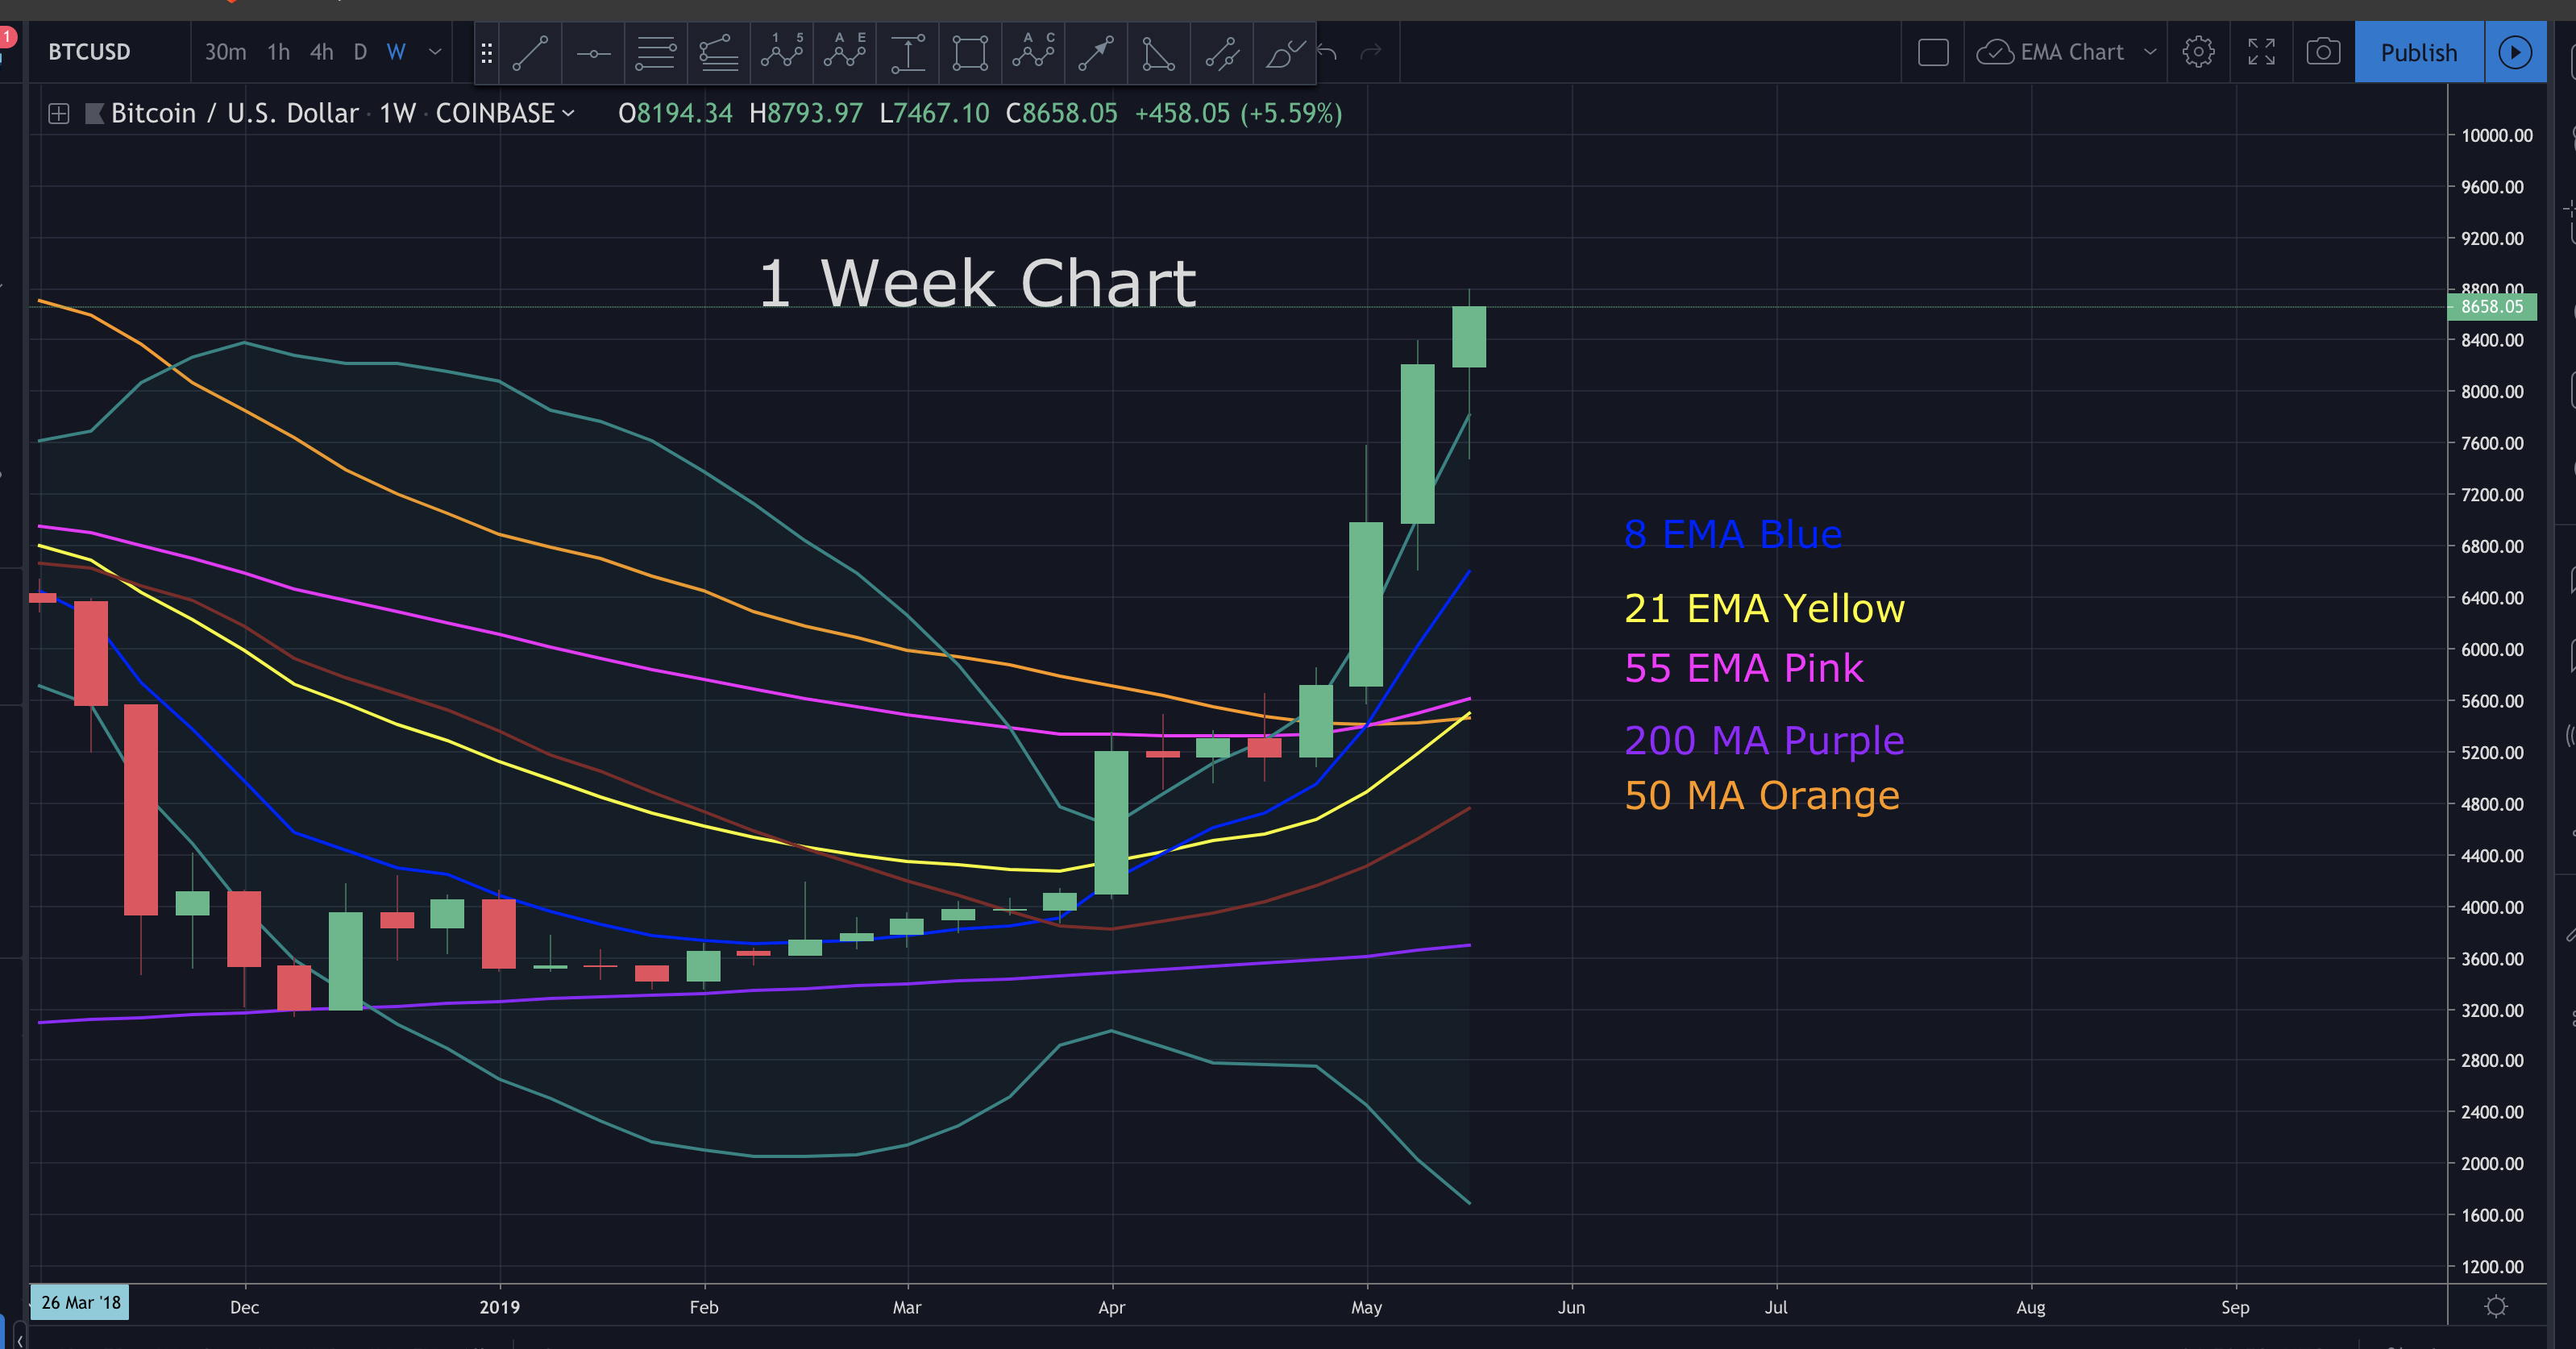
Looking at the weekly chart, we can see the 21 week EMA is about to cross above the 55 week EMA…a very bullish indication. That said, we can also see just how extended price is, well above the upper weekly Bollinger band.
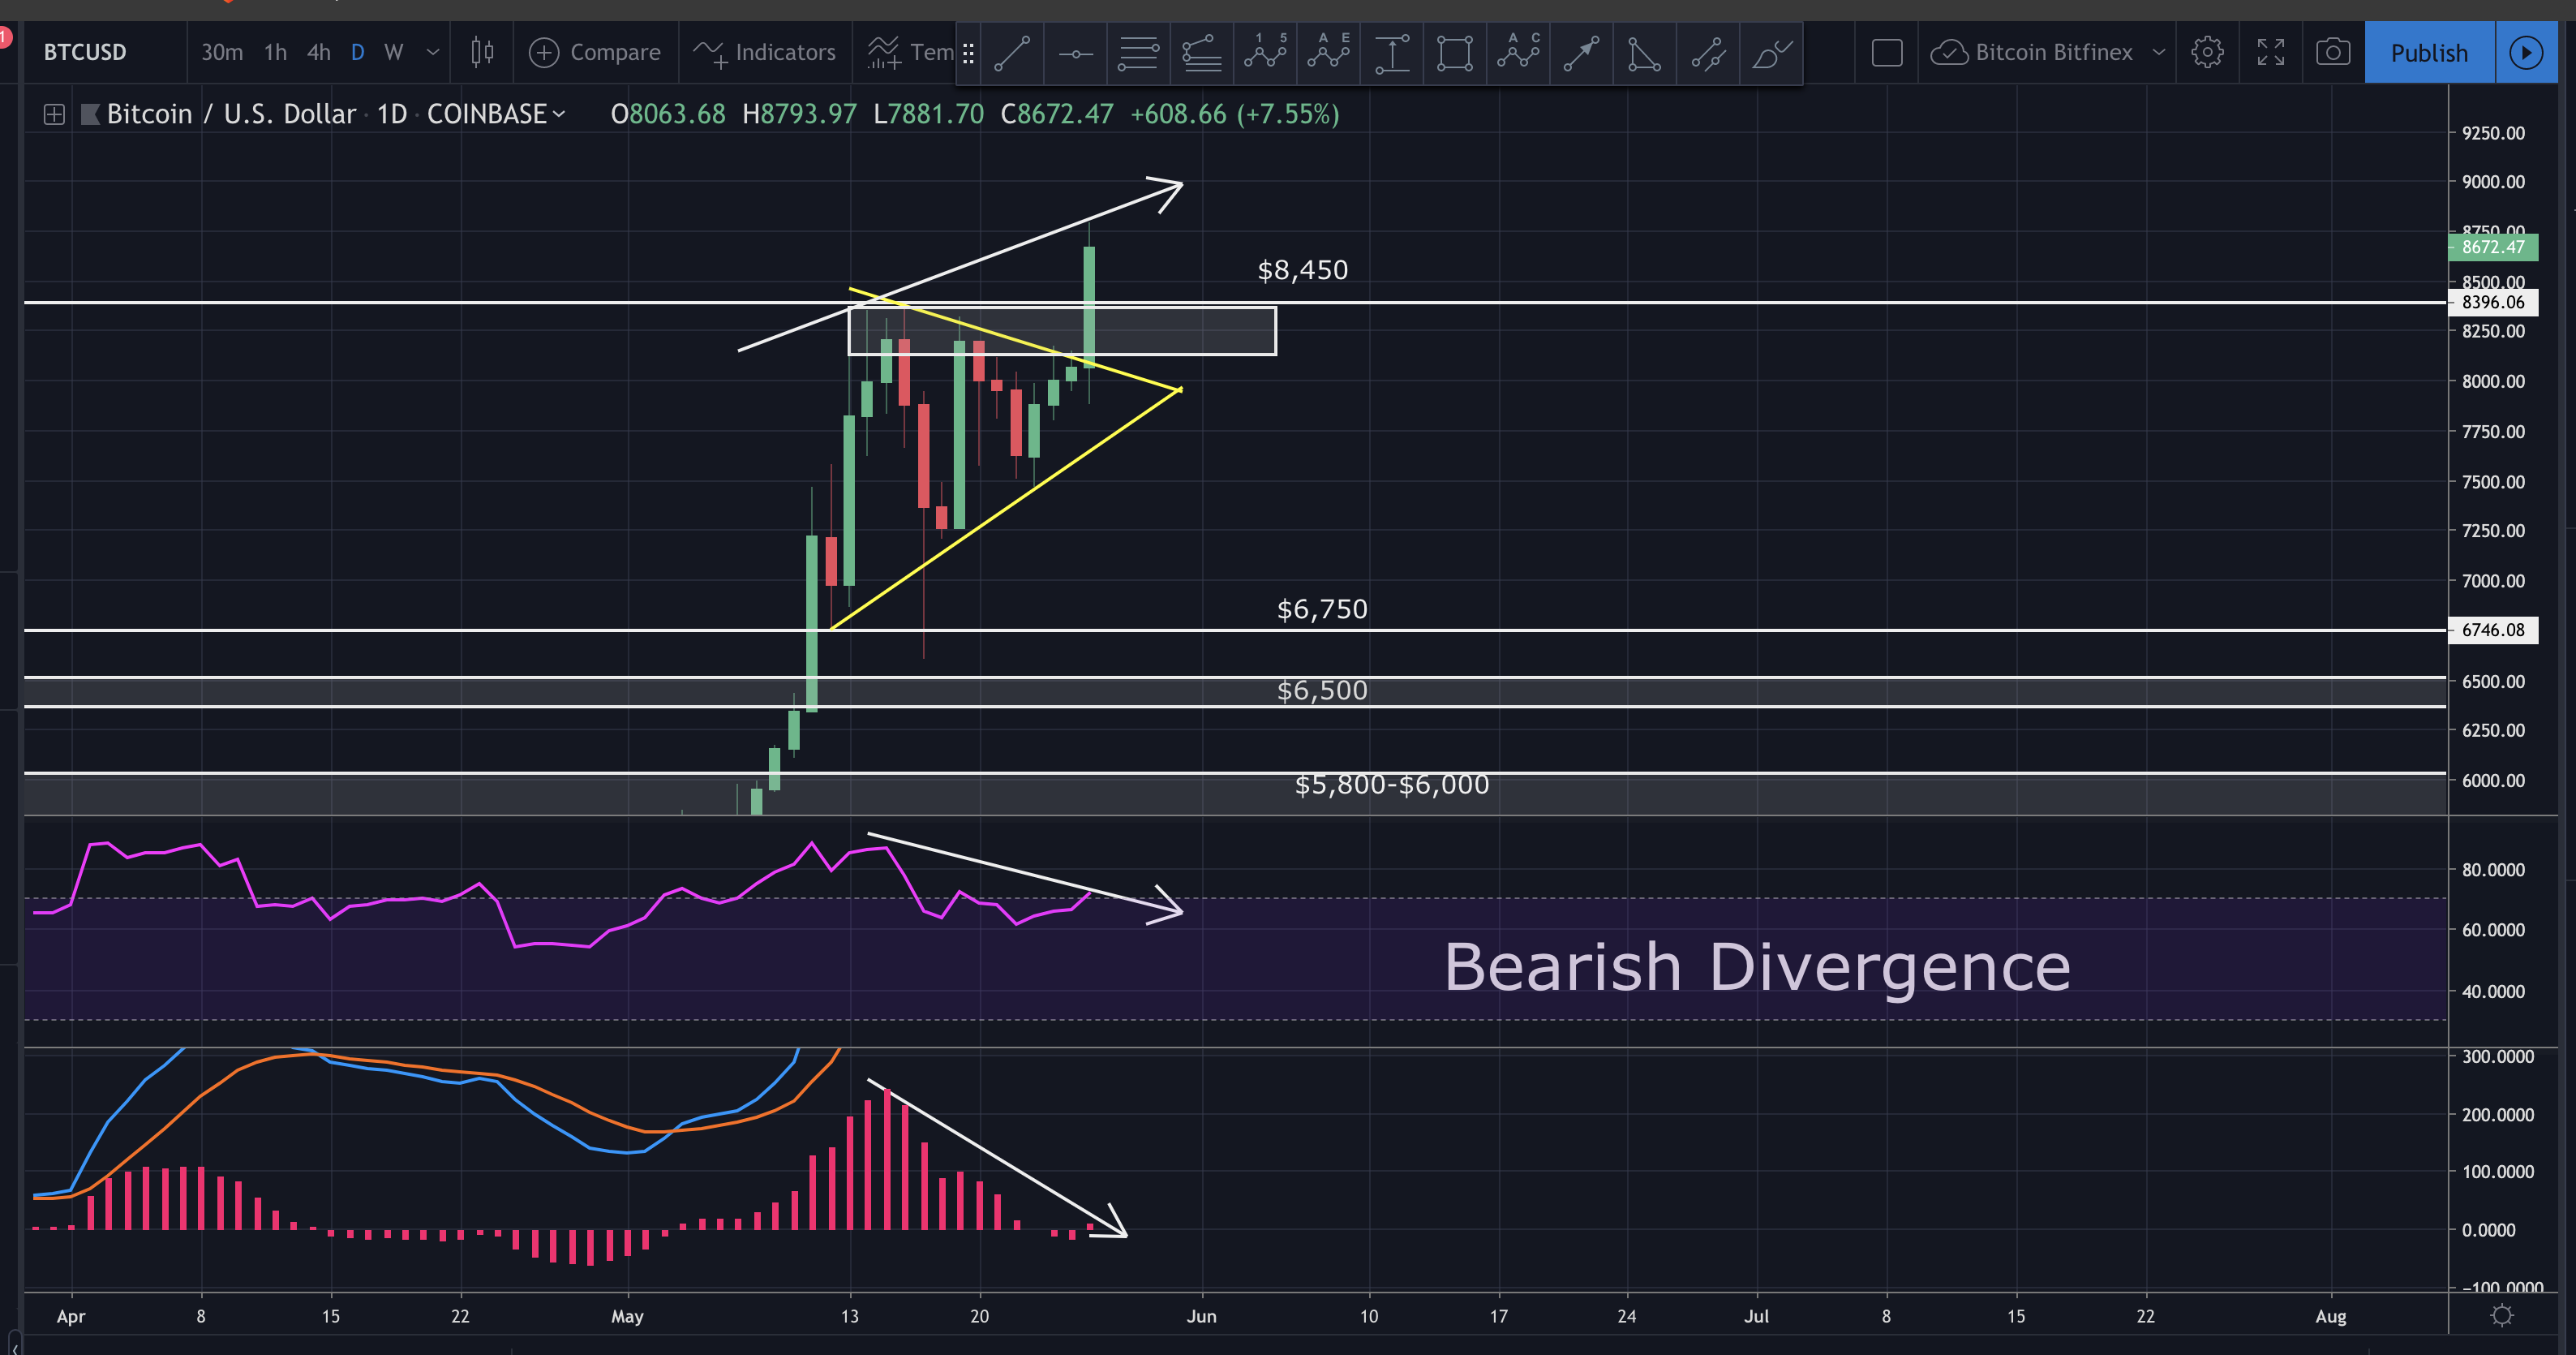
Zooming into the daily chart, we can see bearish divergence on the RSI and MACD.
In today’s analysis I discuss where price may be heading from here, traps to avoid, targets and so much more. I hope you find it helpful.
Video Analysis:
If you don’t see the above video, navigate to TIMM (https://mentormarket.io/workin/) or Steemit in order to watch.
I hope this has been helpful. I’d be happy to answer any questions in the comment section below. Until next time, wishing you safe and profitable trading.
Workin
If you found this post informative, please:

Open a free account on Binance here:
https://www.binance.com/?ref=16878853
Get paid for viewing ads and Support the Crypto Ecosystem with Brave Browser. Free download here:
https://brave.com/wor485
YouTube: https://www.youtube.com/channel/UCJqGczdWE99ORopJ5ZUDauA
Twitter: https://twitter.com/workin2005
Facebook: https://www.facebook.com/Workin2005
Feature Image By: Saul Gravy
Get involved!
Comments