
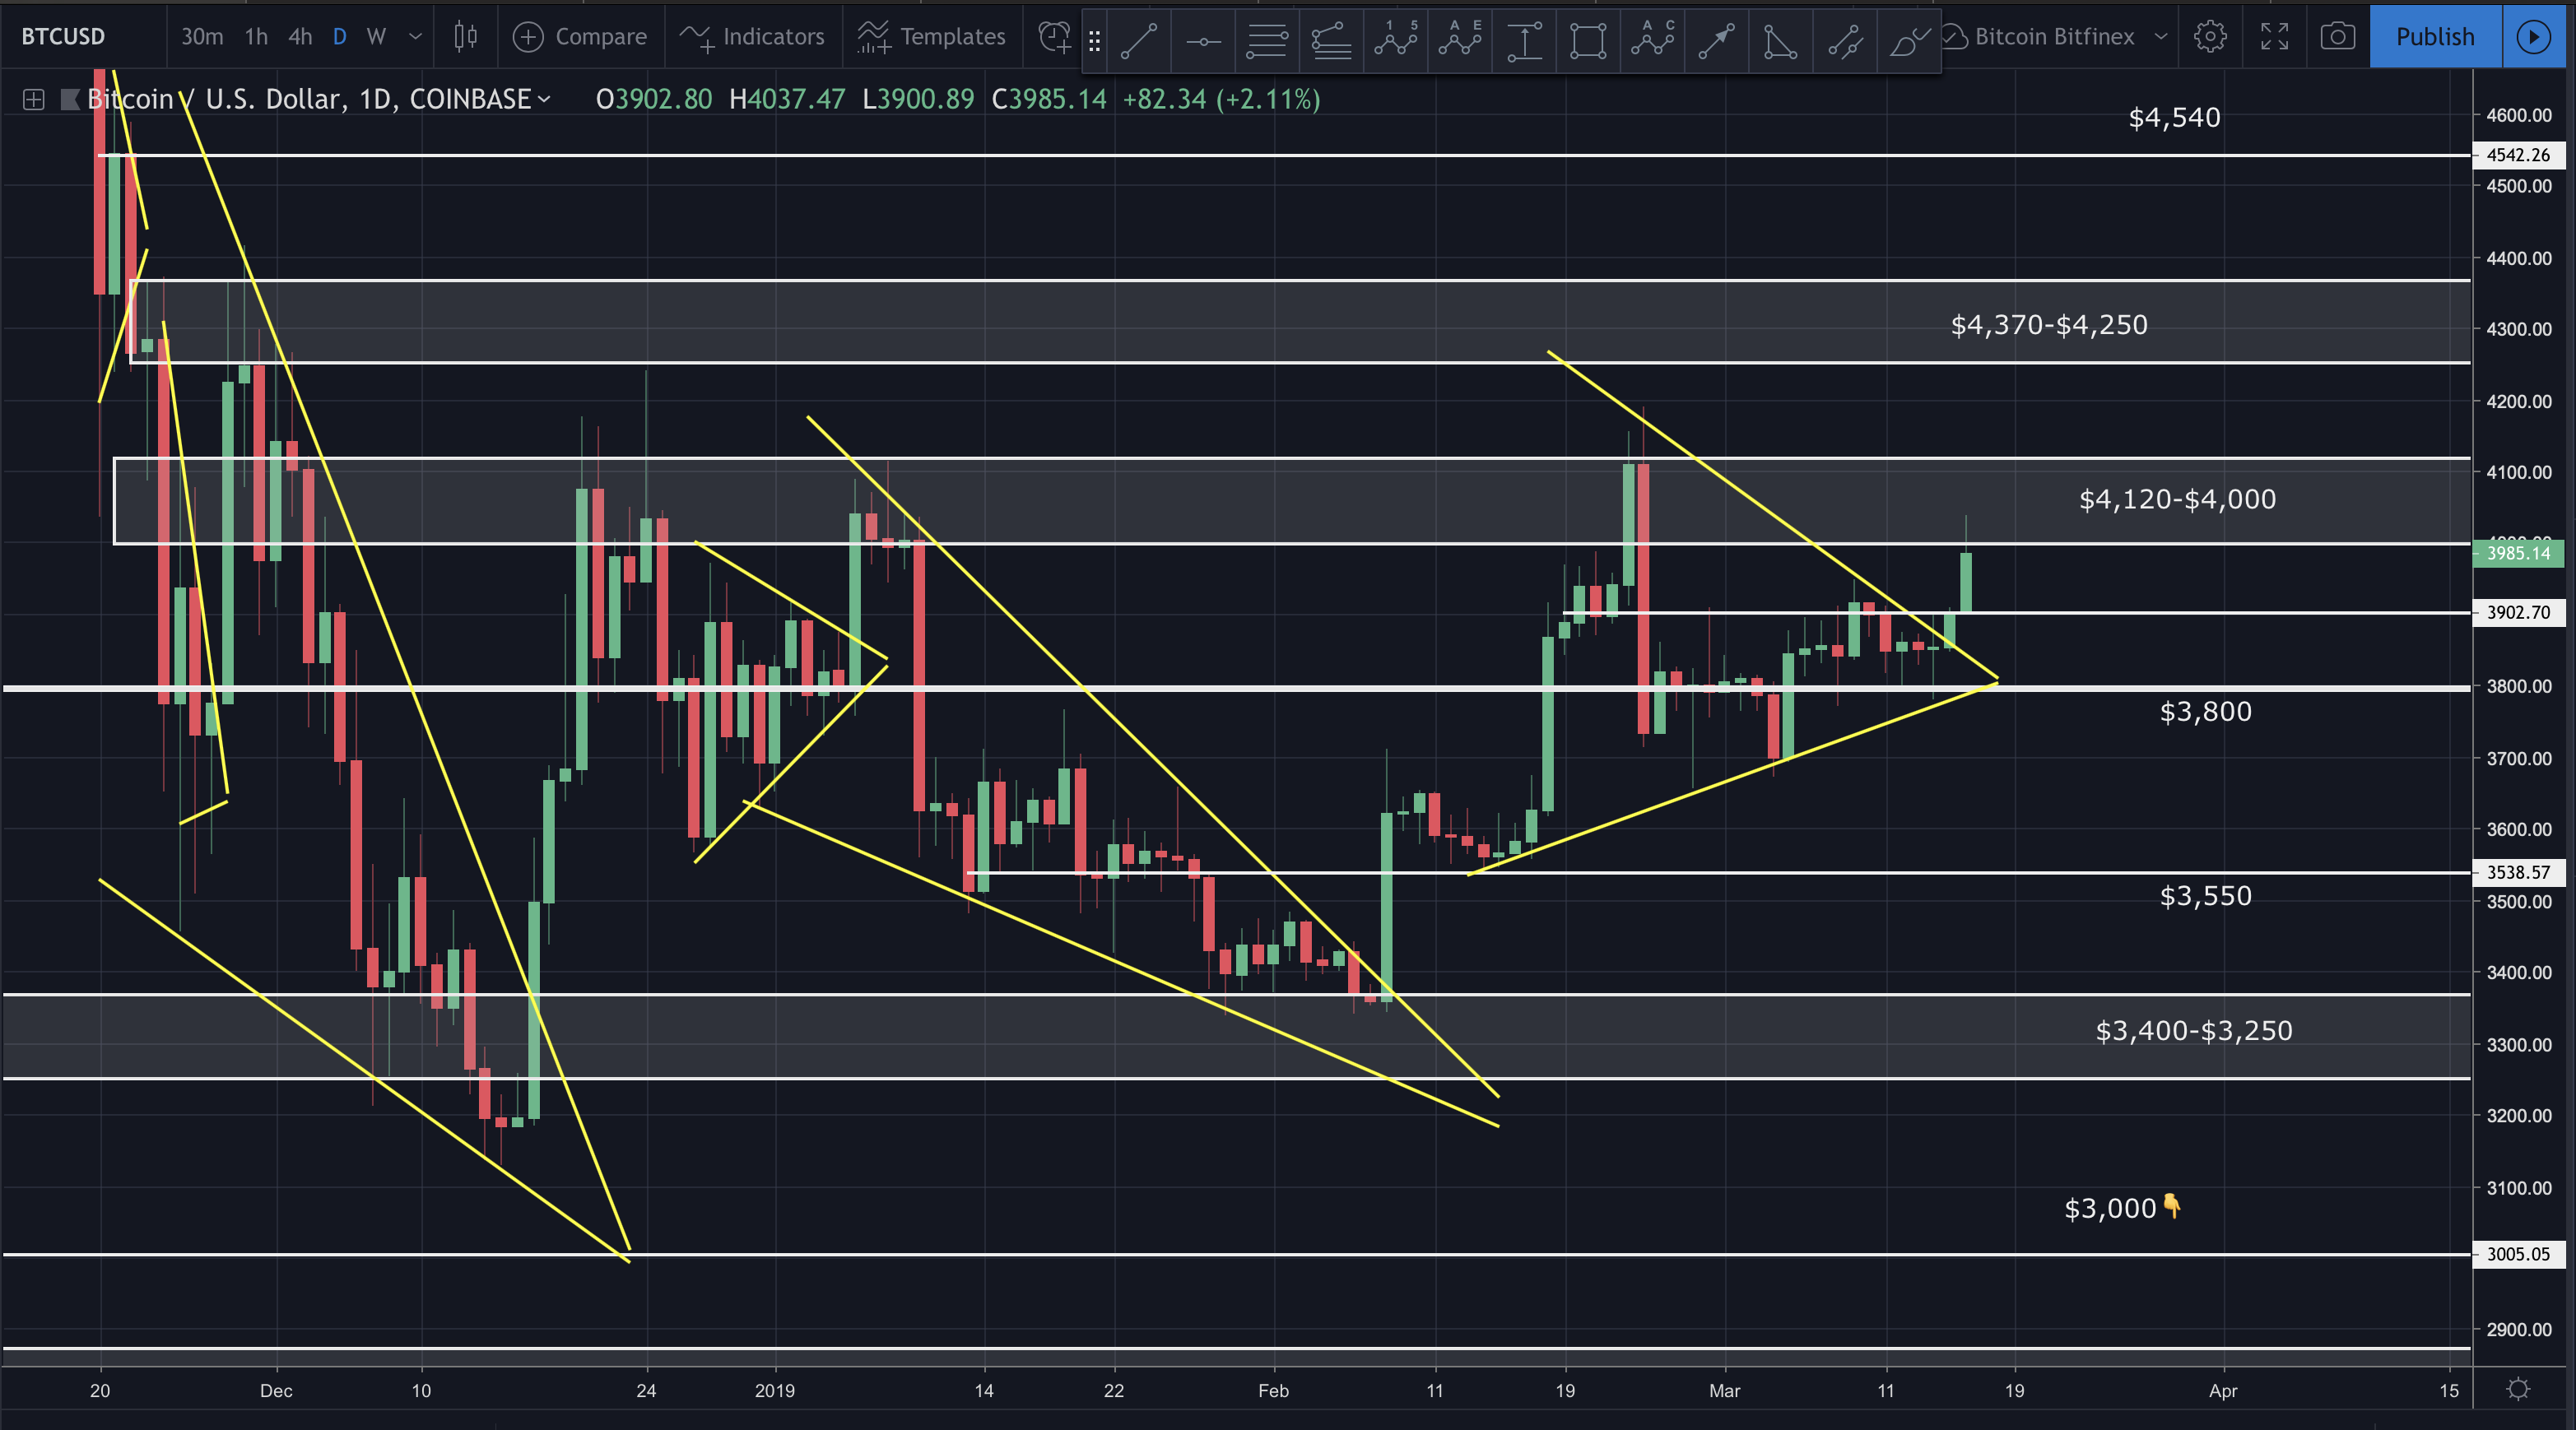
Bitcoin is finally testing heavy resistance between $4,000 and $4,120 (Coinbase). A decisive break above could signal the start of at least a temporary bull run, while another strong rejection may lead to lower lows.
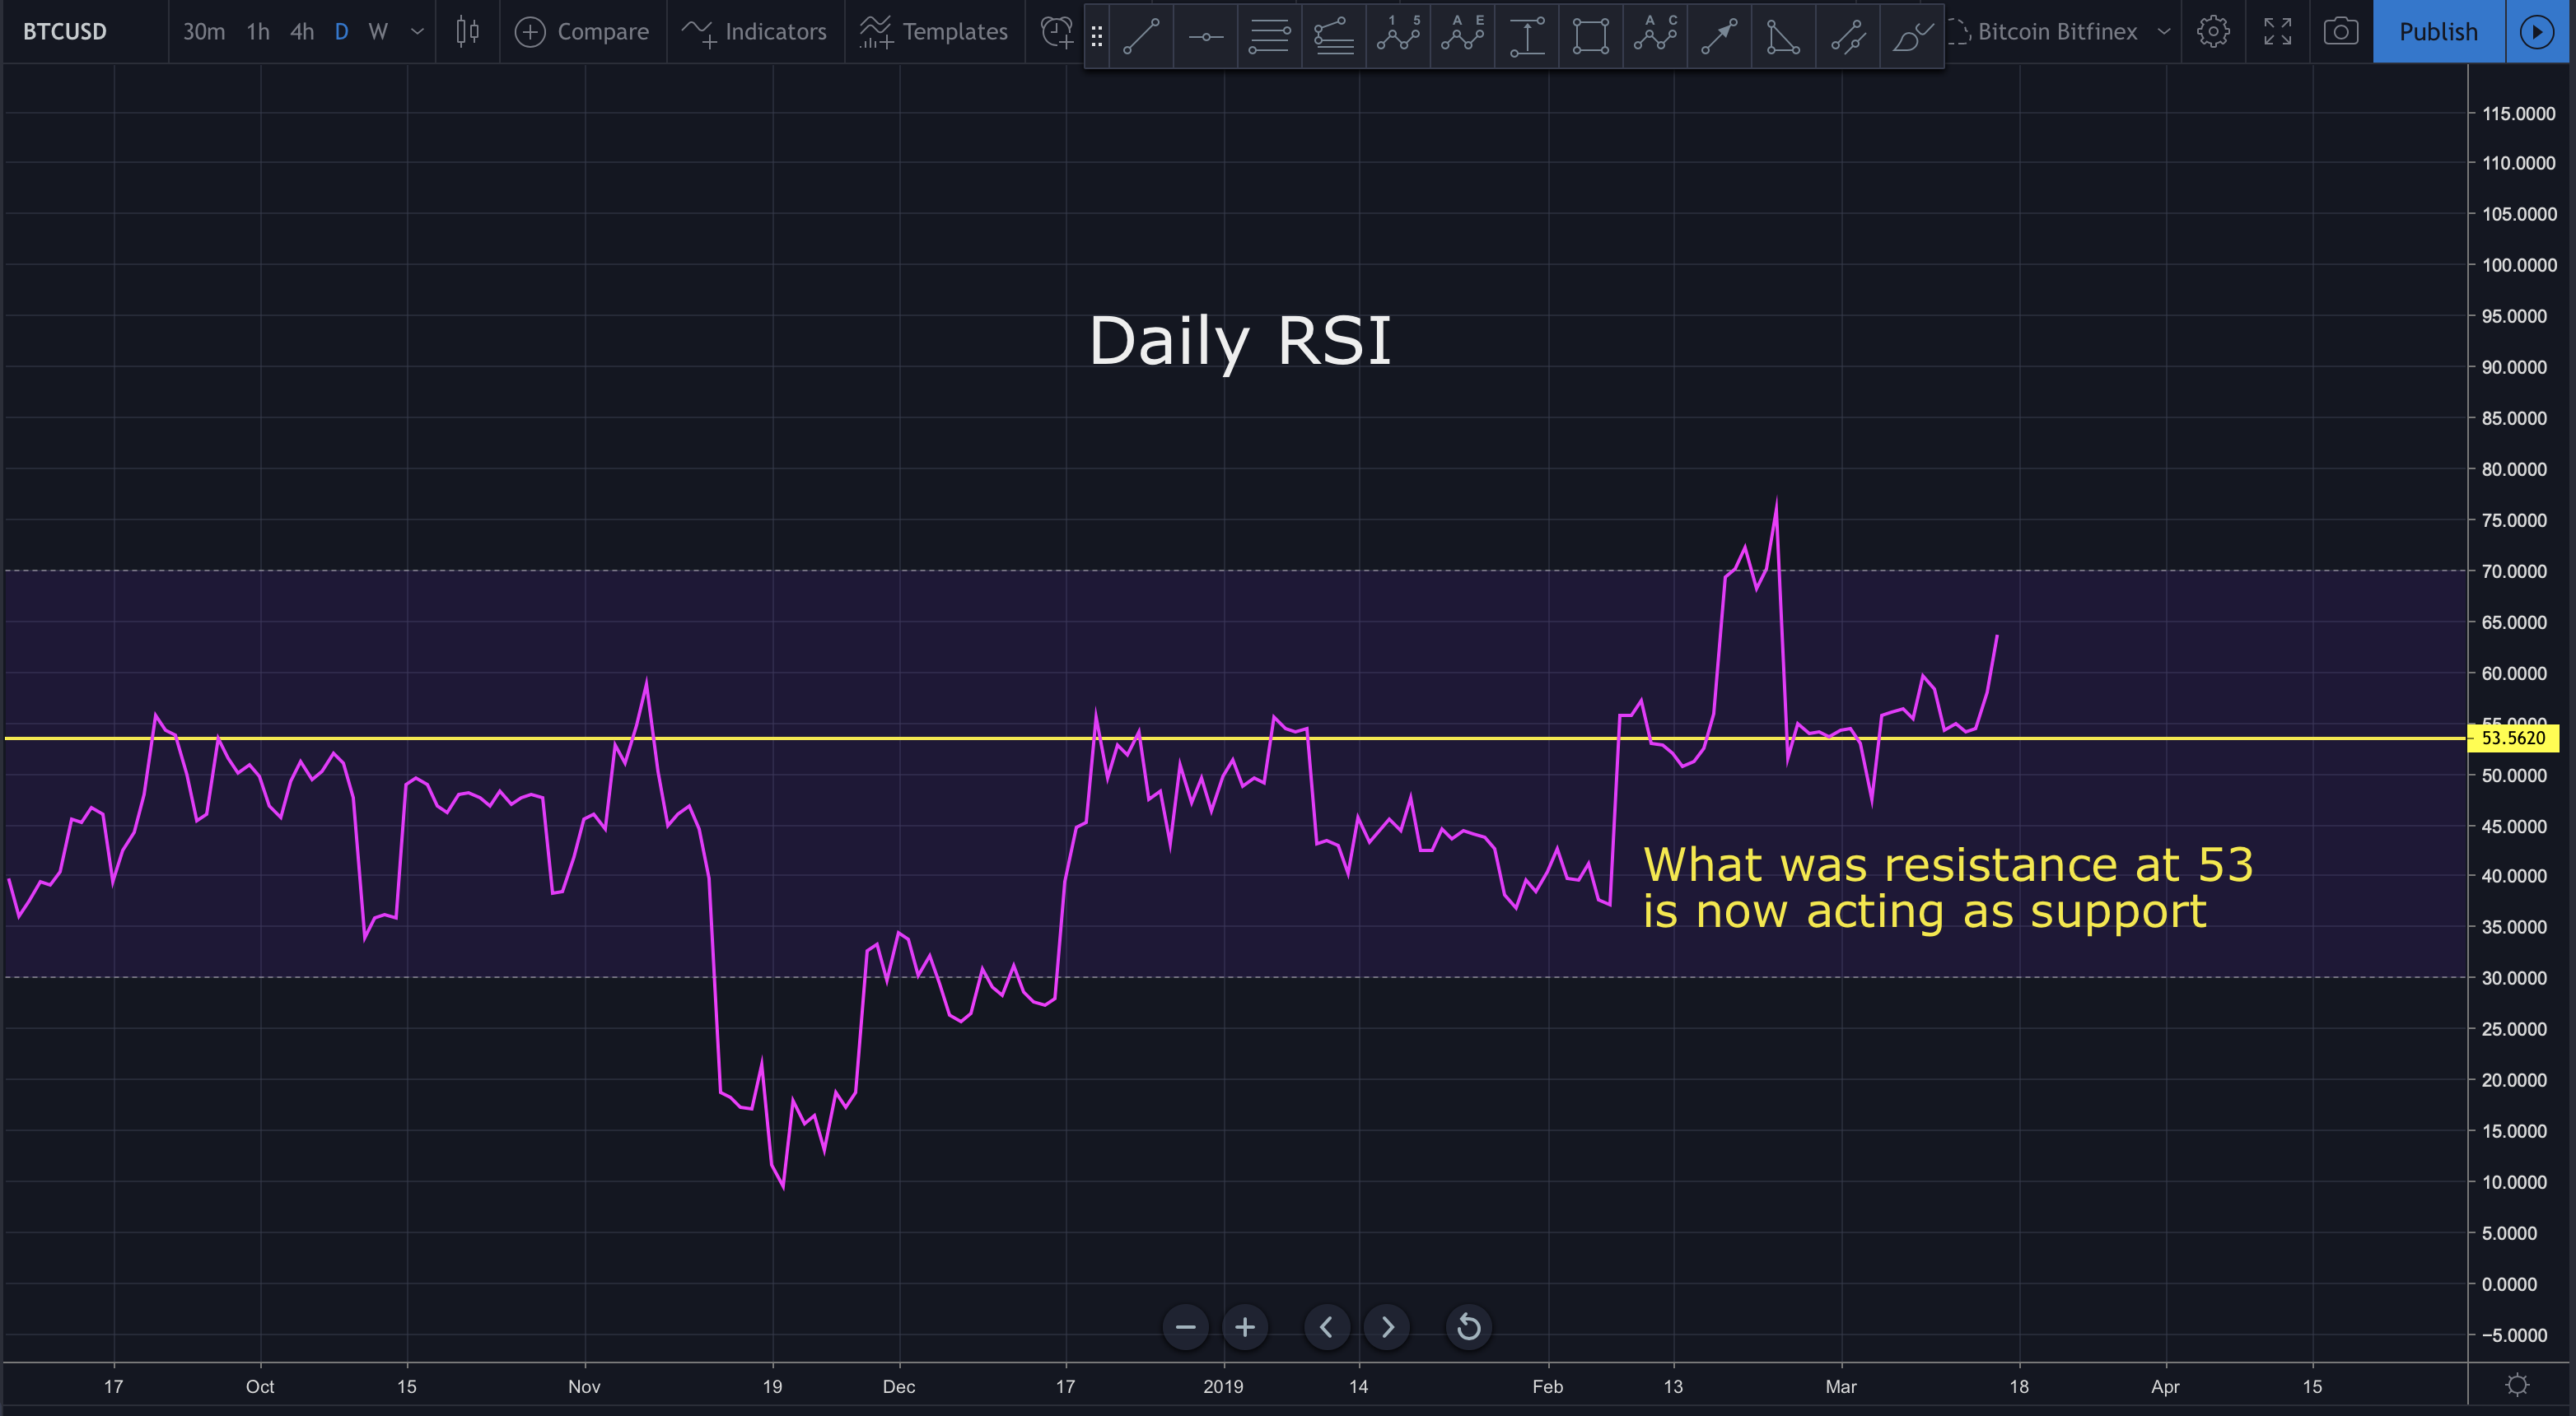
The daily RSI is looking bullish. There was strong resistance at 53.5 for months. That resistance appears to now be acting as support.
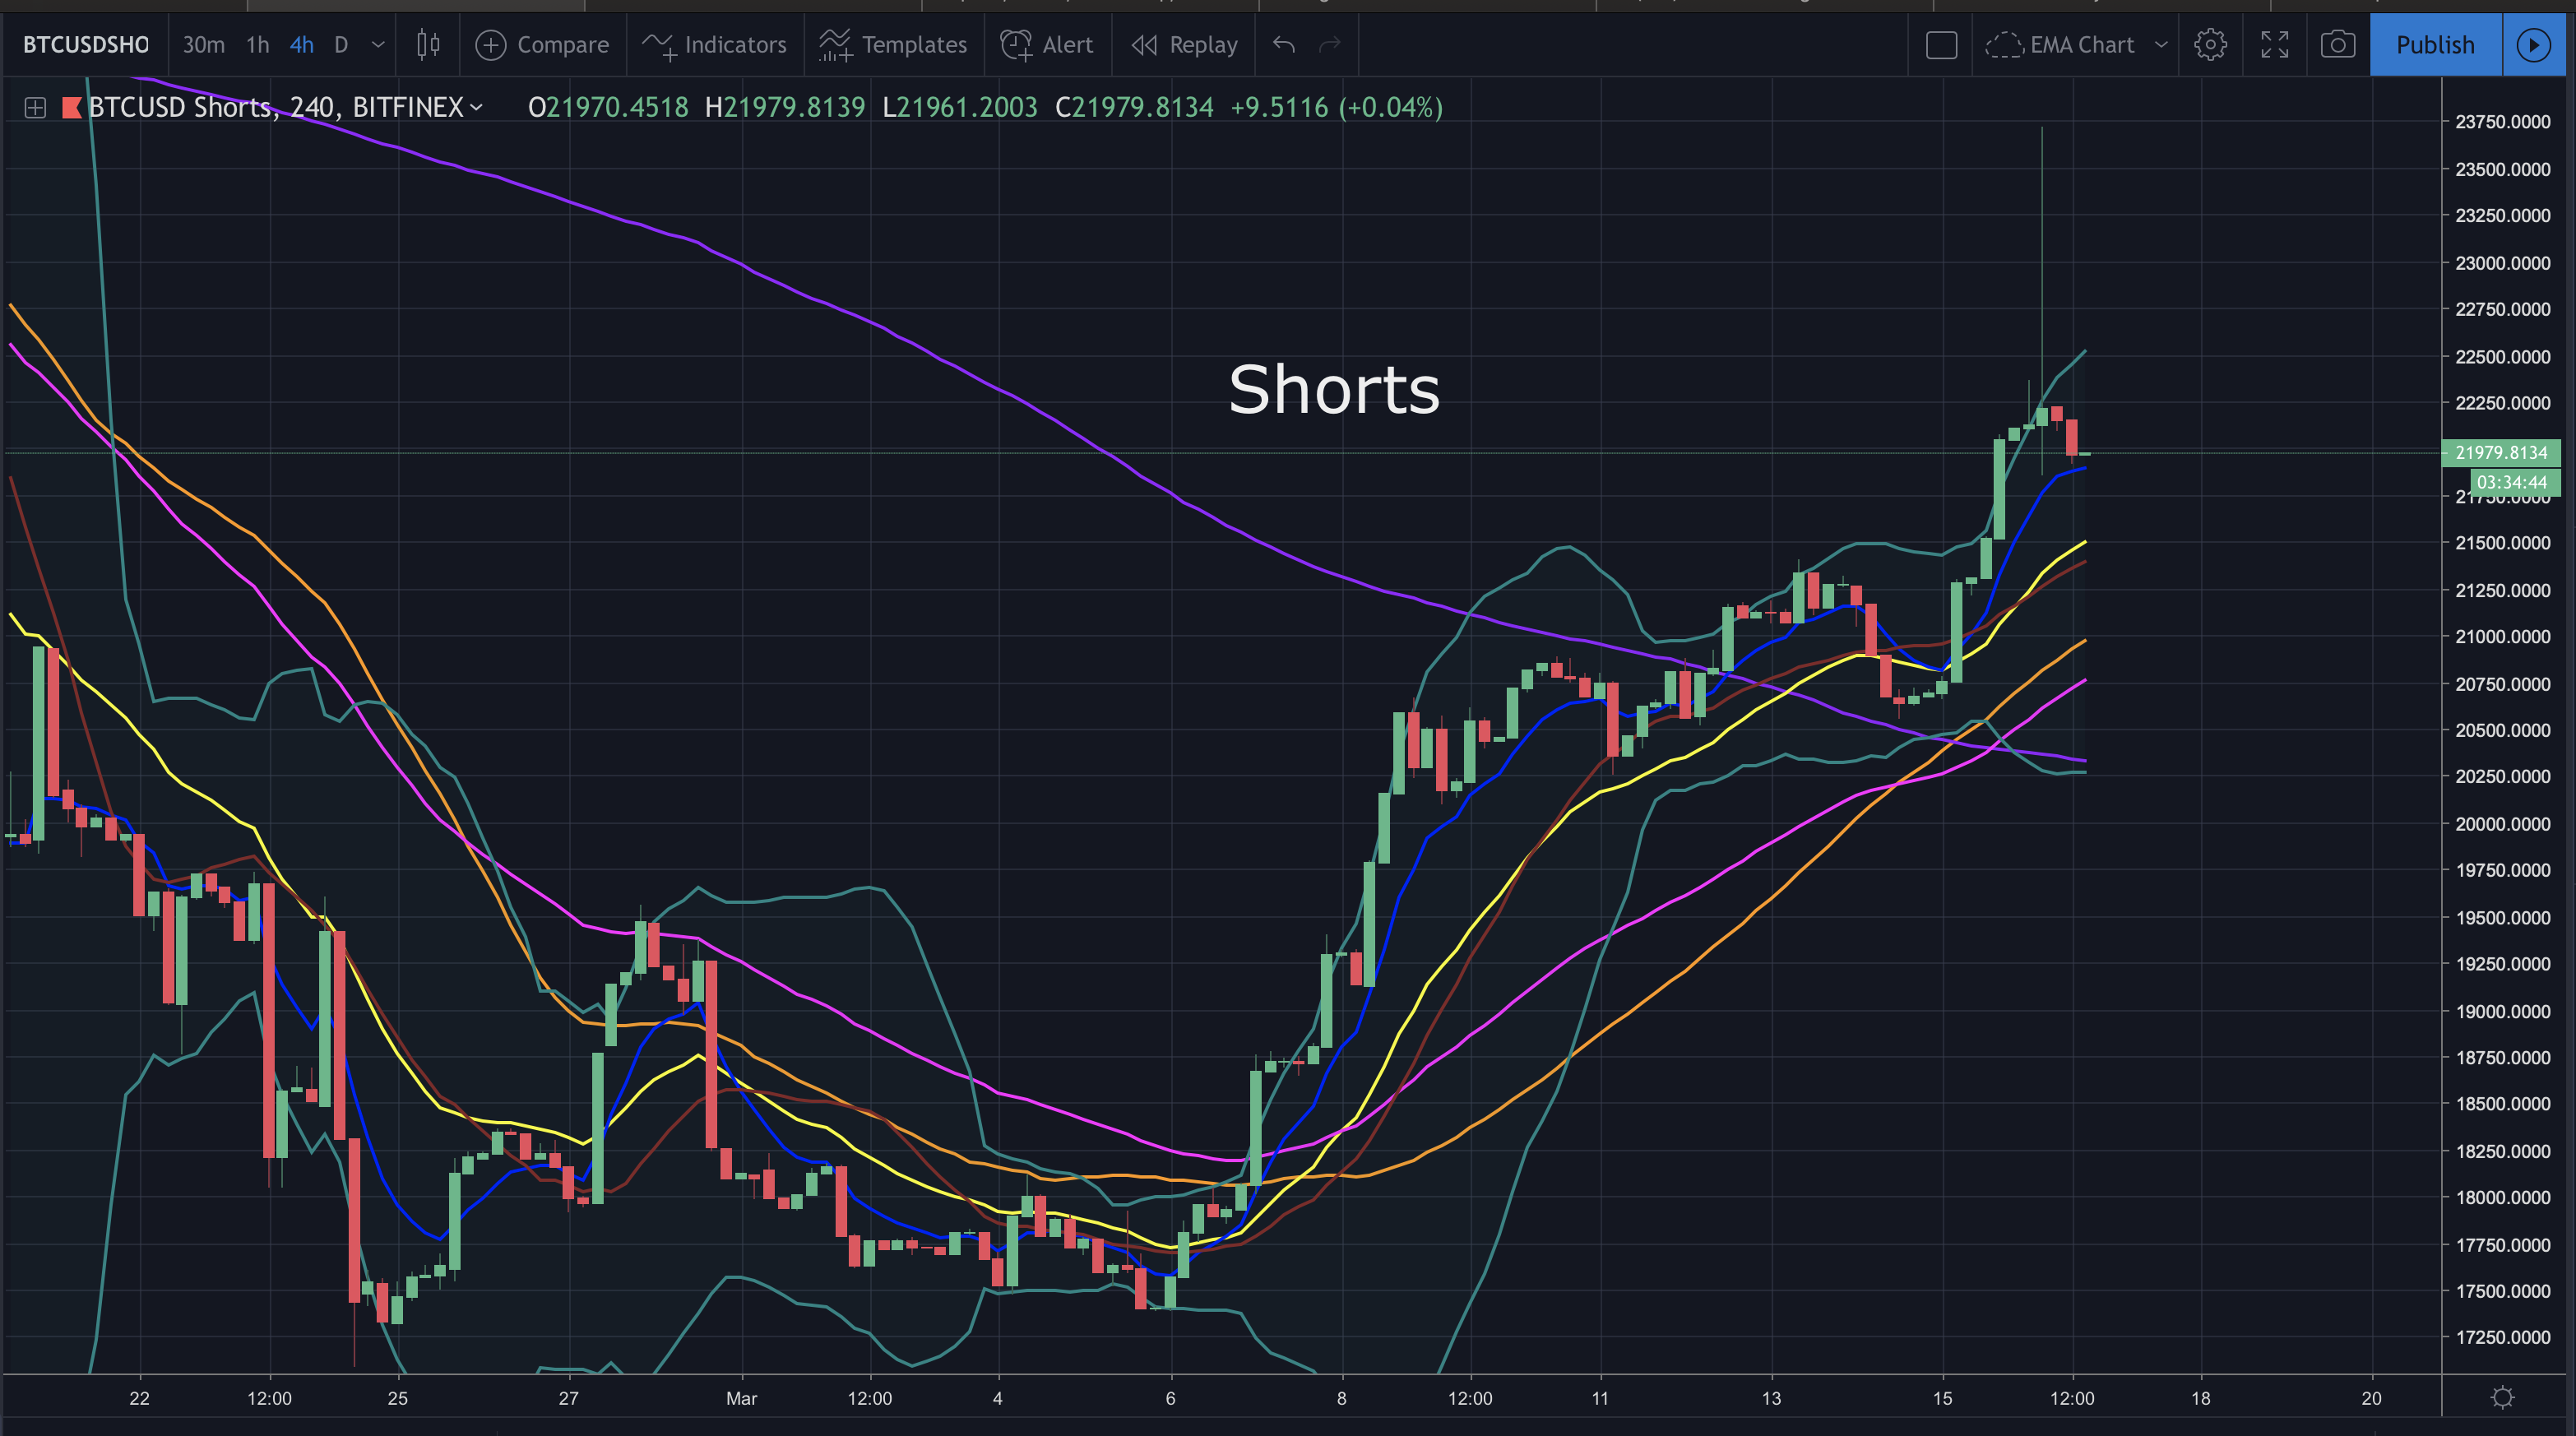
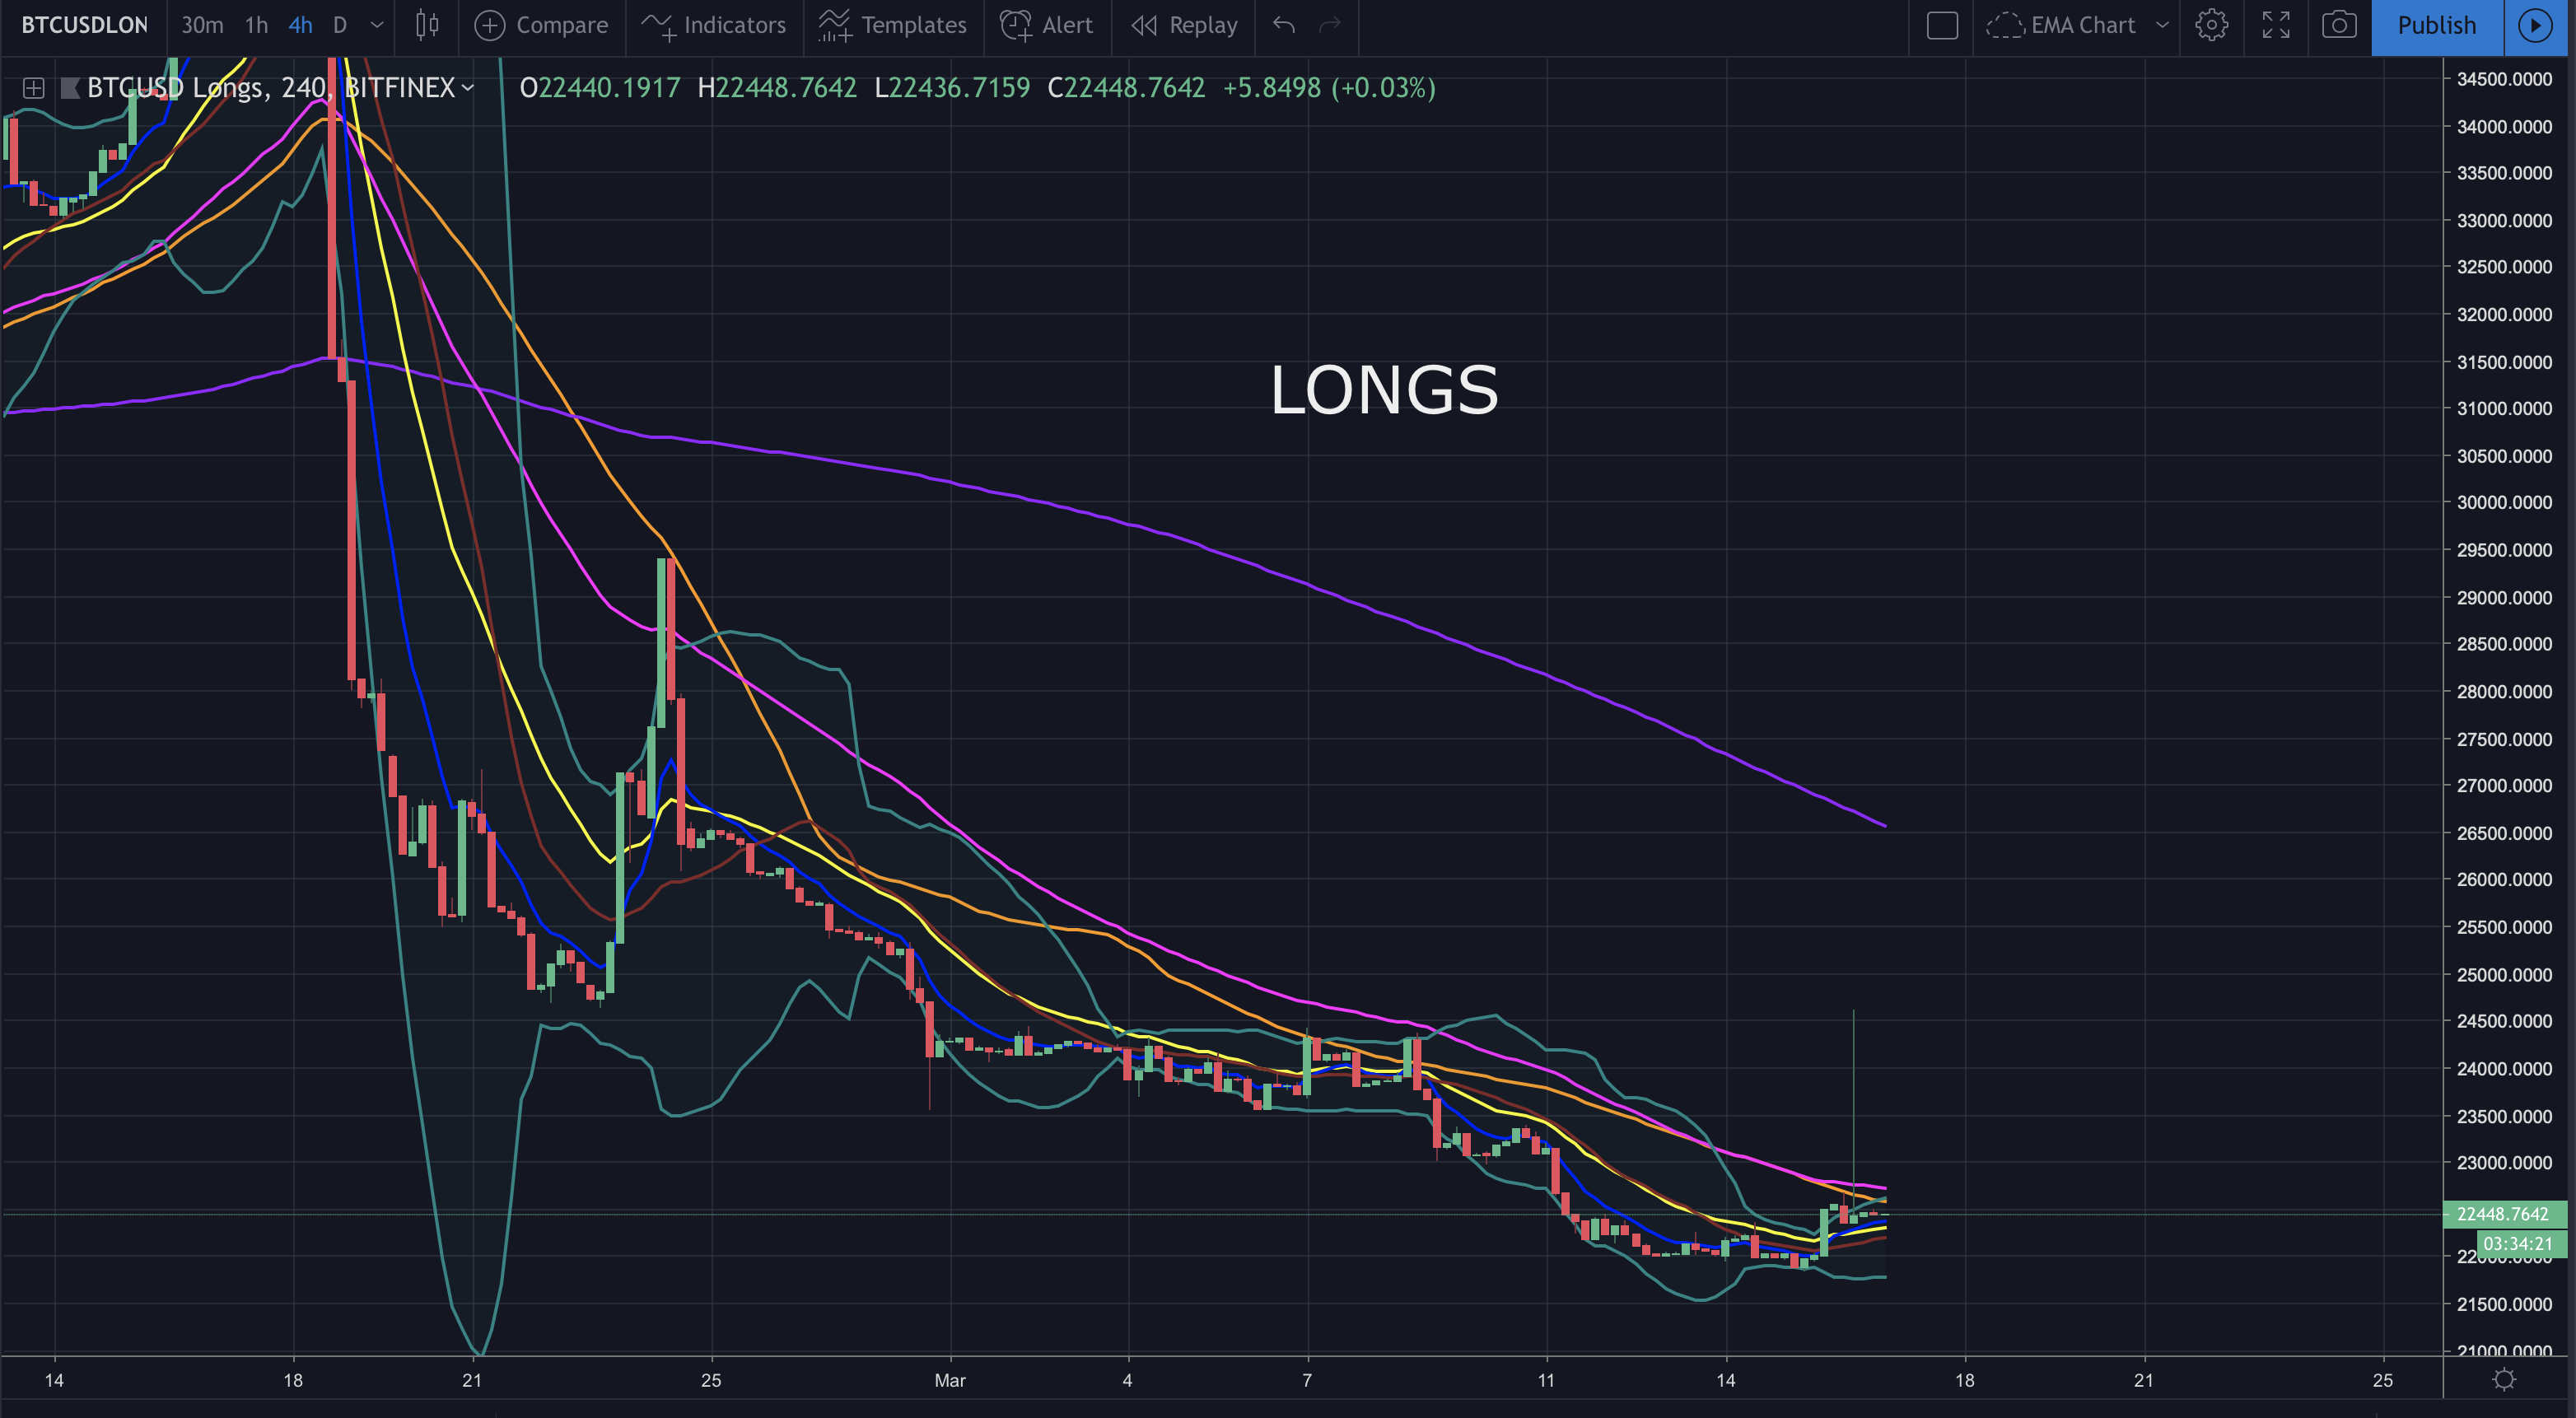
Shorts remain stacked while longs are relatively unchanged.
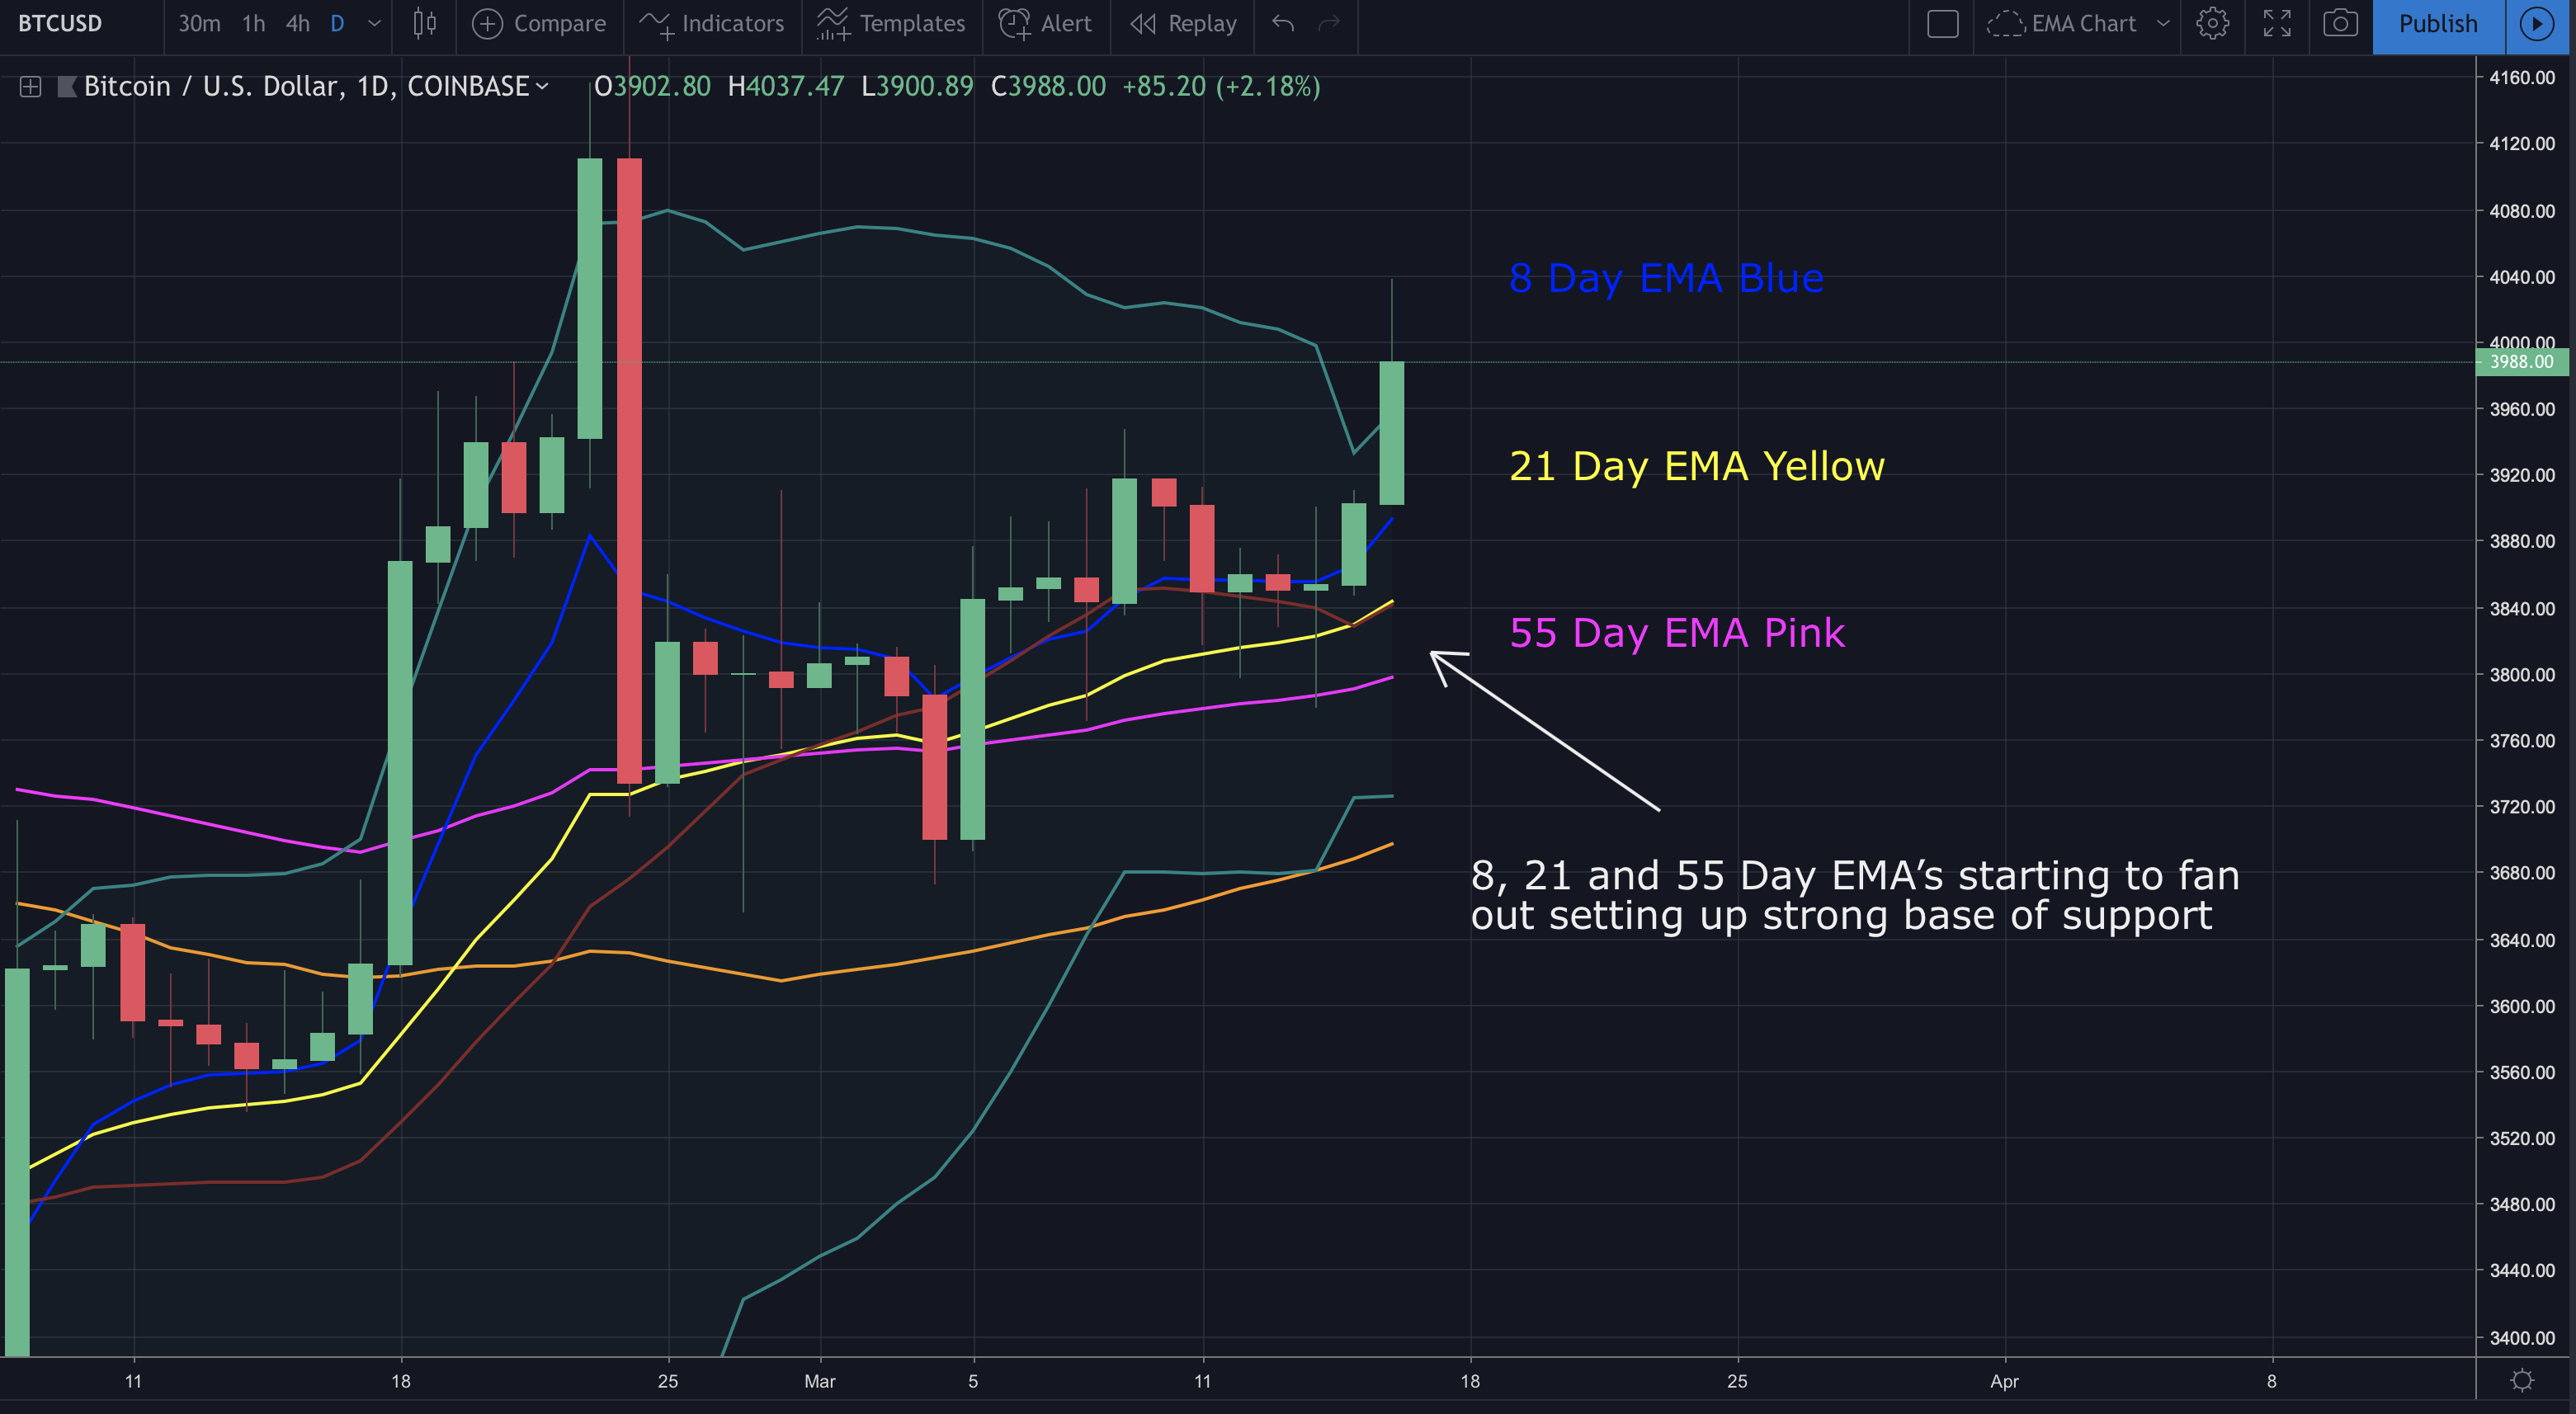
Looking at the daily chart, we can see the 8 day EMA remains on top of the 21 which is on top of the 55 day EMA. They’re starting to fan out which is bullish. This signals strong support building below price.
In today’s analysis I discuss where price may be heading next. I discuss traps to avoid, key areas to watch and so much more. I hope you find it helpful.
Video Analysis:
If you don’t see the above video, navigate to TIMM (https://mentormarket.io/workin/) or Steemit in order to watch.
I hope this has been helpful. I’d be happy to answer any questions in the comment section below. Until next time, wishing you safe and profitable trading!
Workin
If you found this post informative, please:

Open an Account on Binance here:
https://www.binance.com/?ref=16878853
Support the Crypto Ecosystem with Brave Browser:
https://brave.com/wor485
Twitter handle is @Workin2005 and Facebook is https://www.facebook.com/Workin2005
Feature Image By: Saul Gravy
Get involved!
Comments