
As discussed in my last video, bitcoin did slightly correct down to about $12,100 before finding support. It’s now trading around $12,500. Daily volume is climbing.
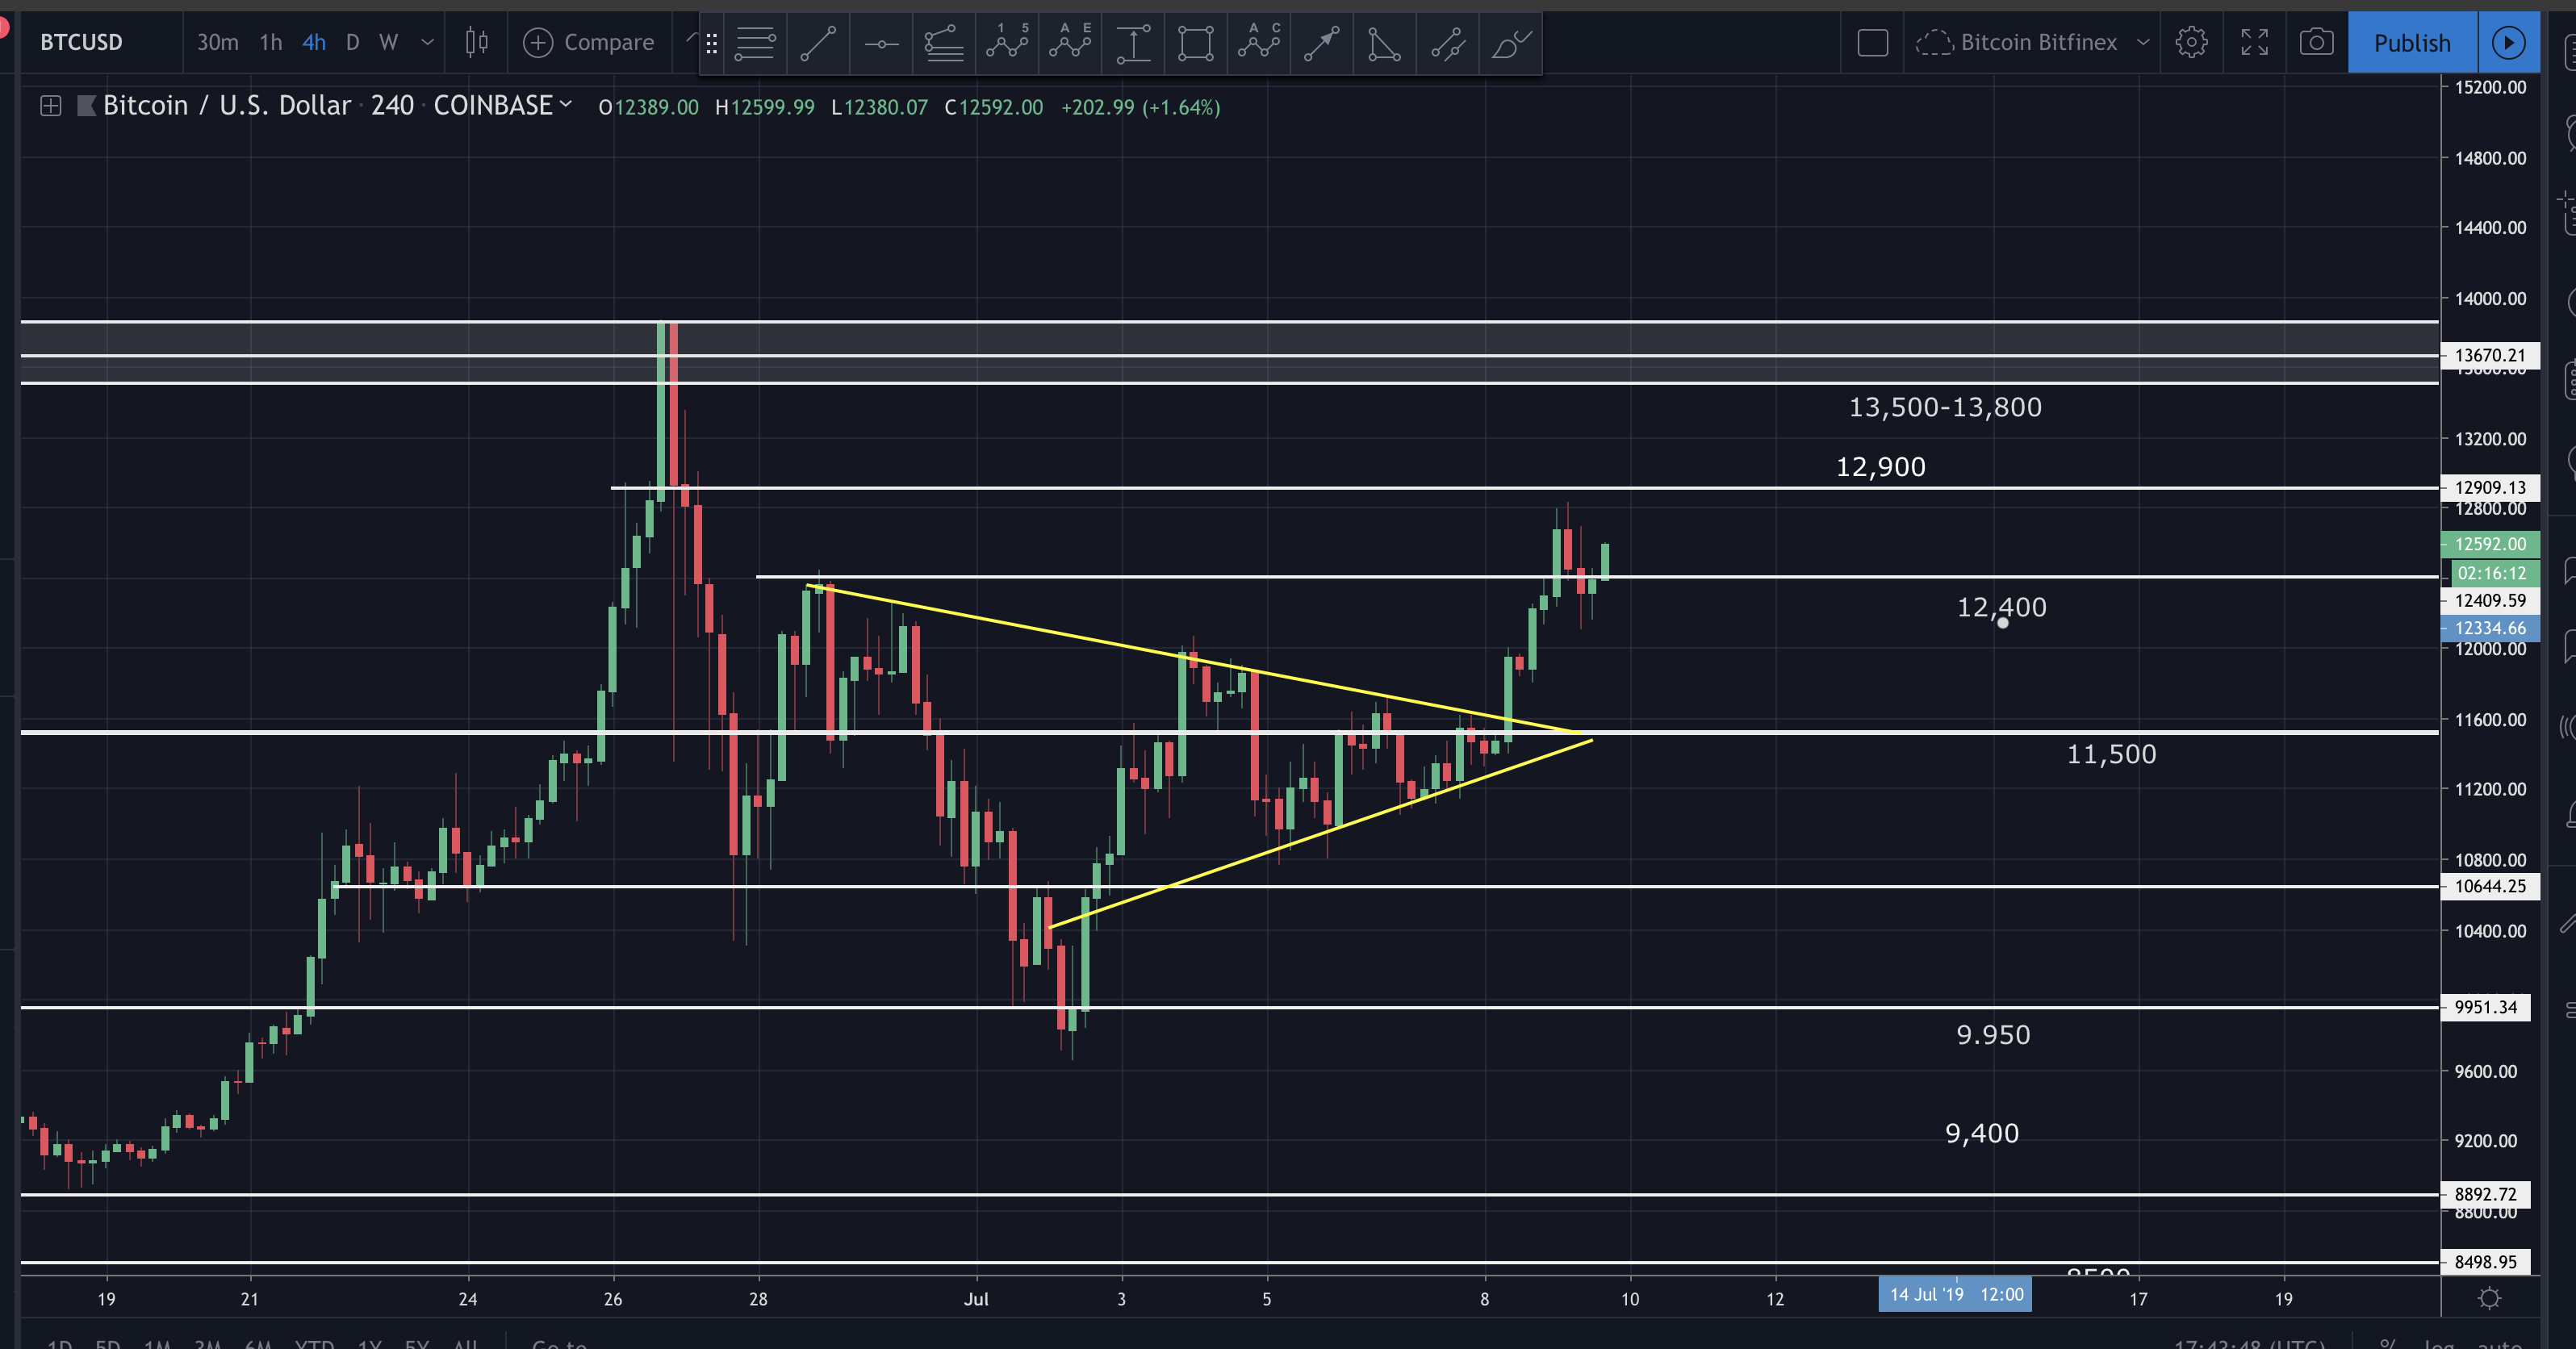
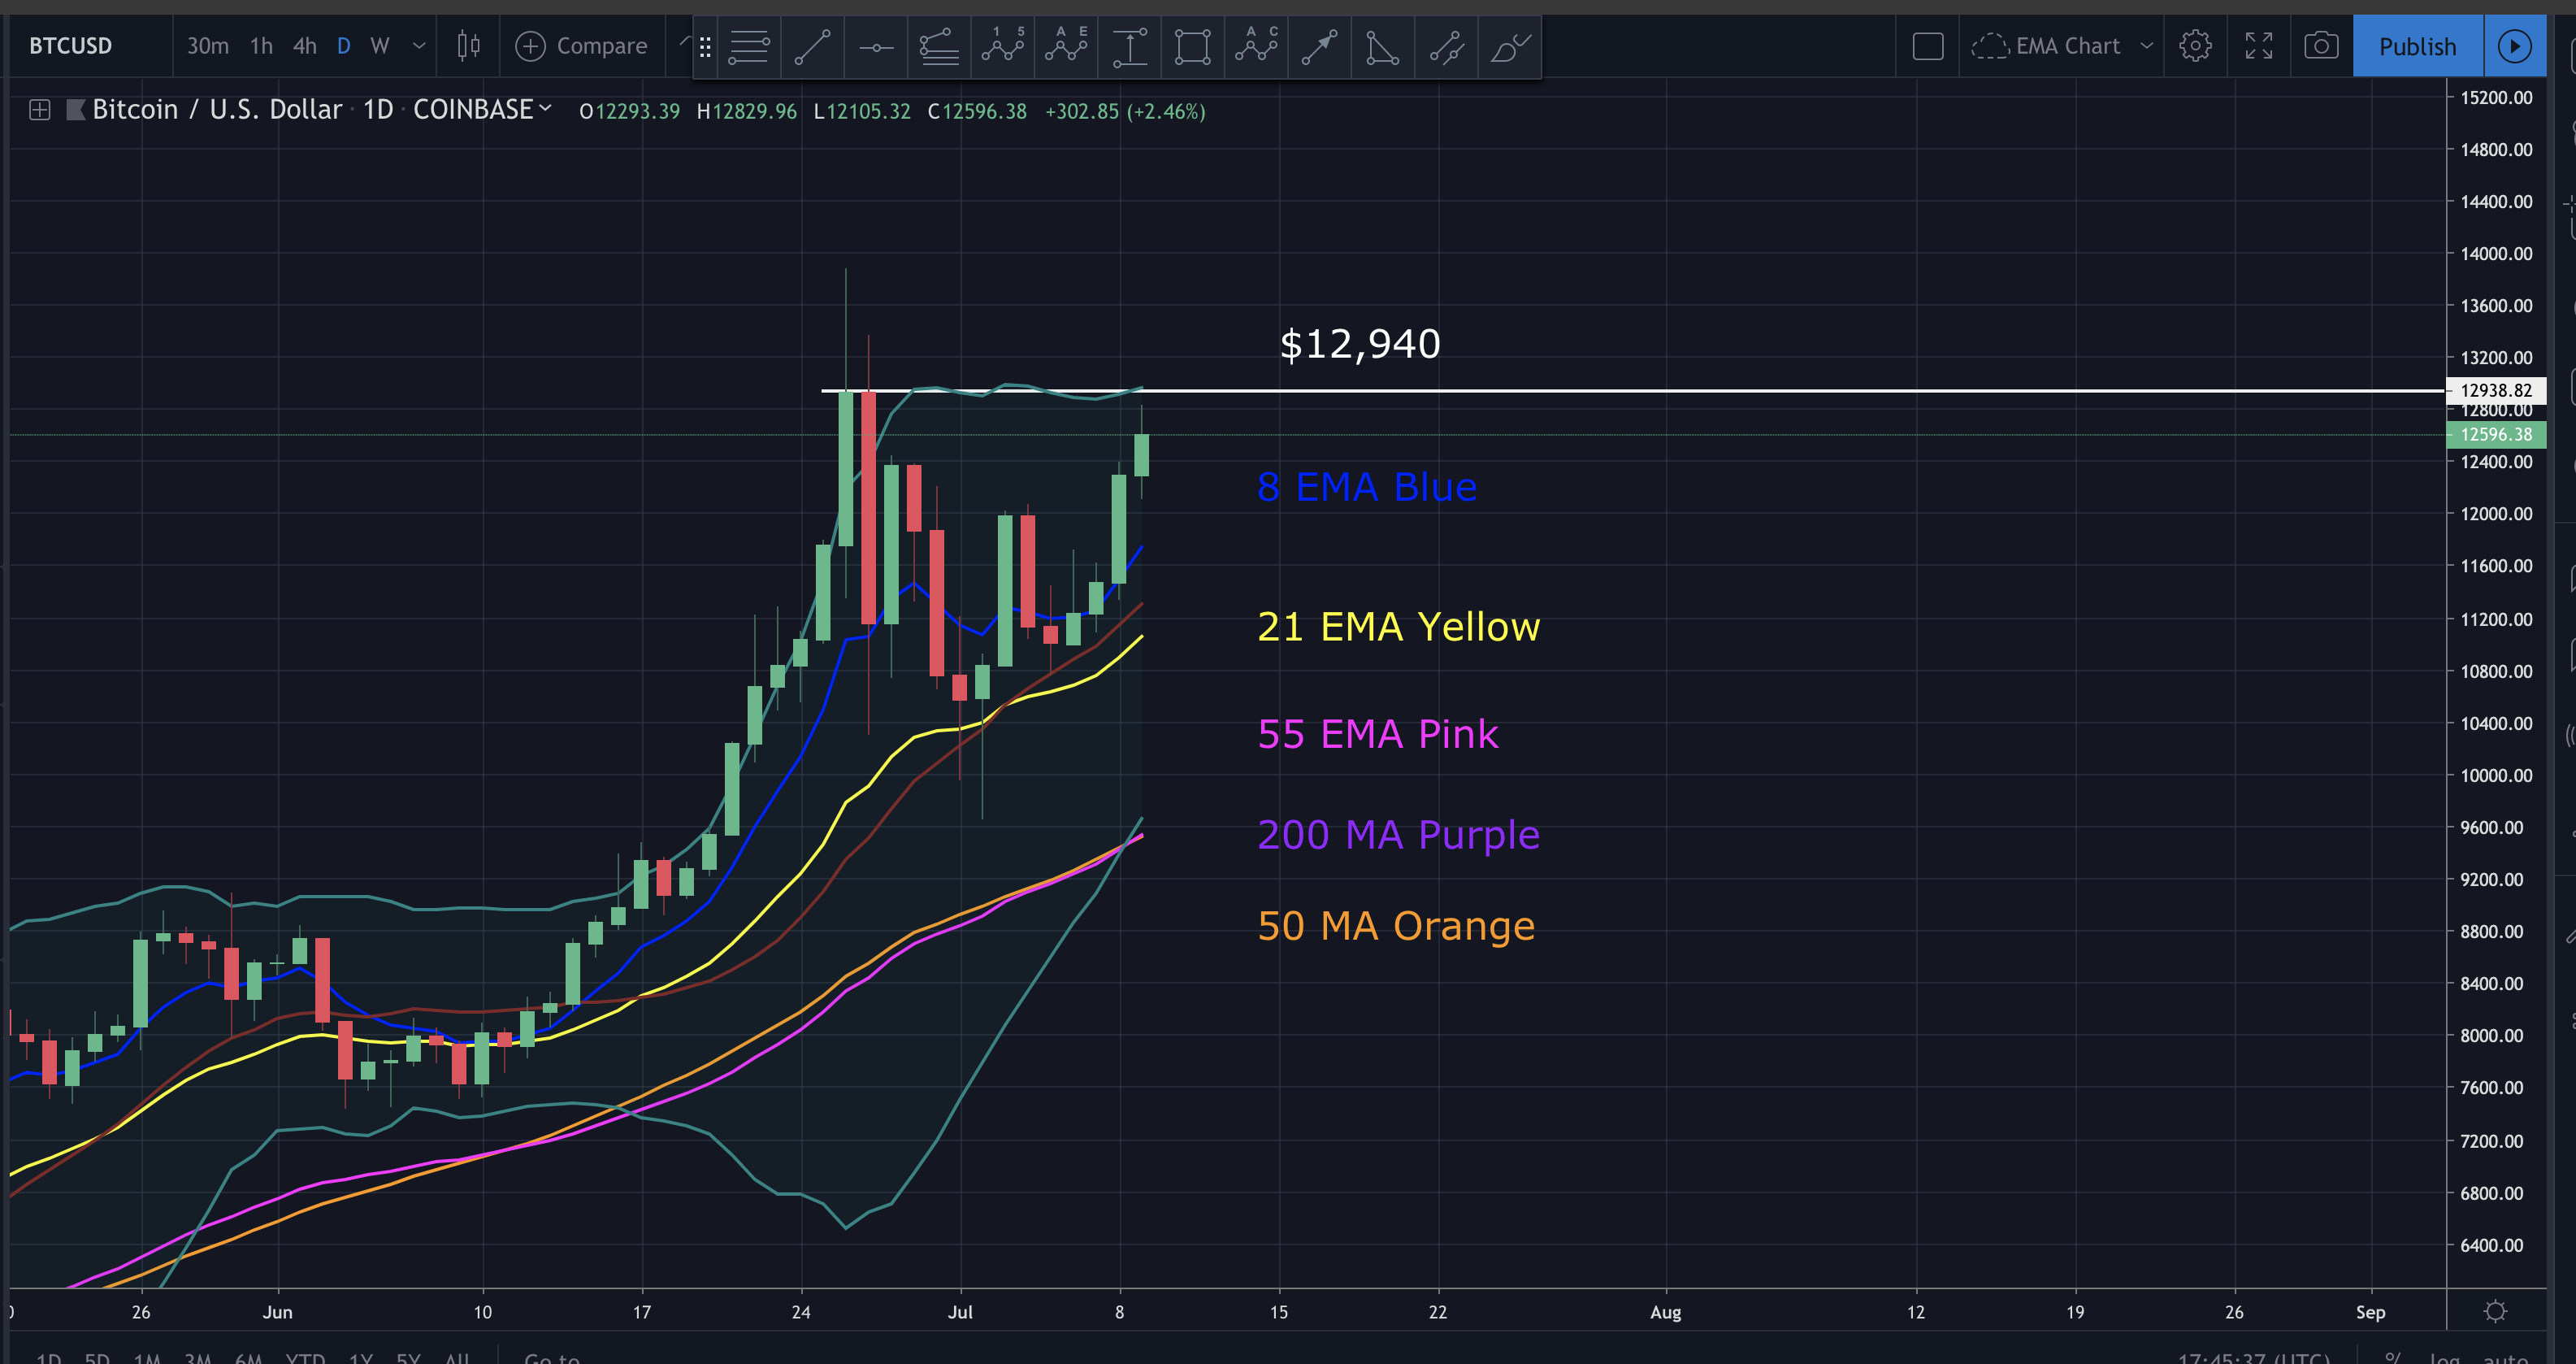
Looking at the daily chart, we can see price approaching a critical zone around $12,950. We’re seeing clear visual resistance as well as the top daily Bollinger bands converging at that area.
In today’s video we discuss where price may go from here, key areas to watch, my Elliot wave count (per your request) and so much more. I’ll also answer some your questions. I hope you find it helpful.
Video Analysis:
If you don’t see the above video, navigate to TIMM (https://mentormarket.io/profile/?workin2005/) or Steemit in order to watch.
I hope this has been helpful. I’d be happy to answer any questions in the comment section below. Until next time, wishing you safe and profitable trading.
Workin
If you found this post informative, please:

Get involved!
Comments