
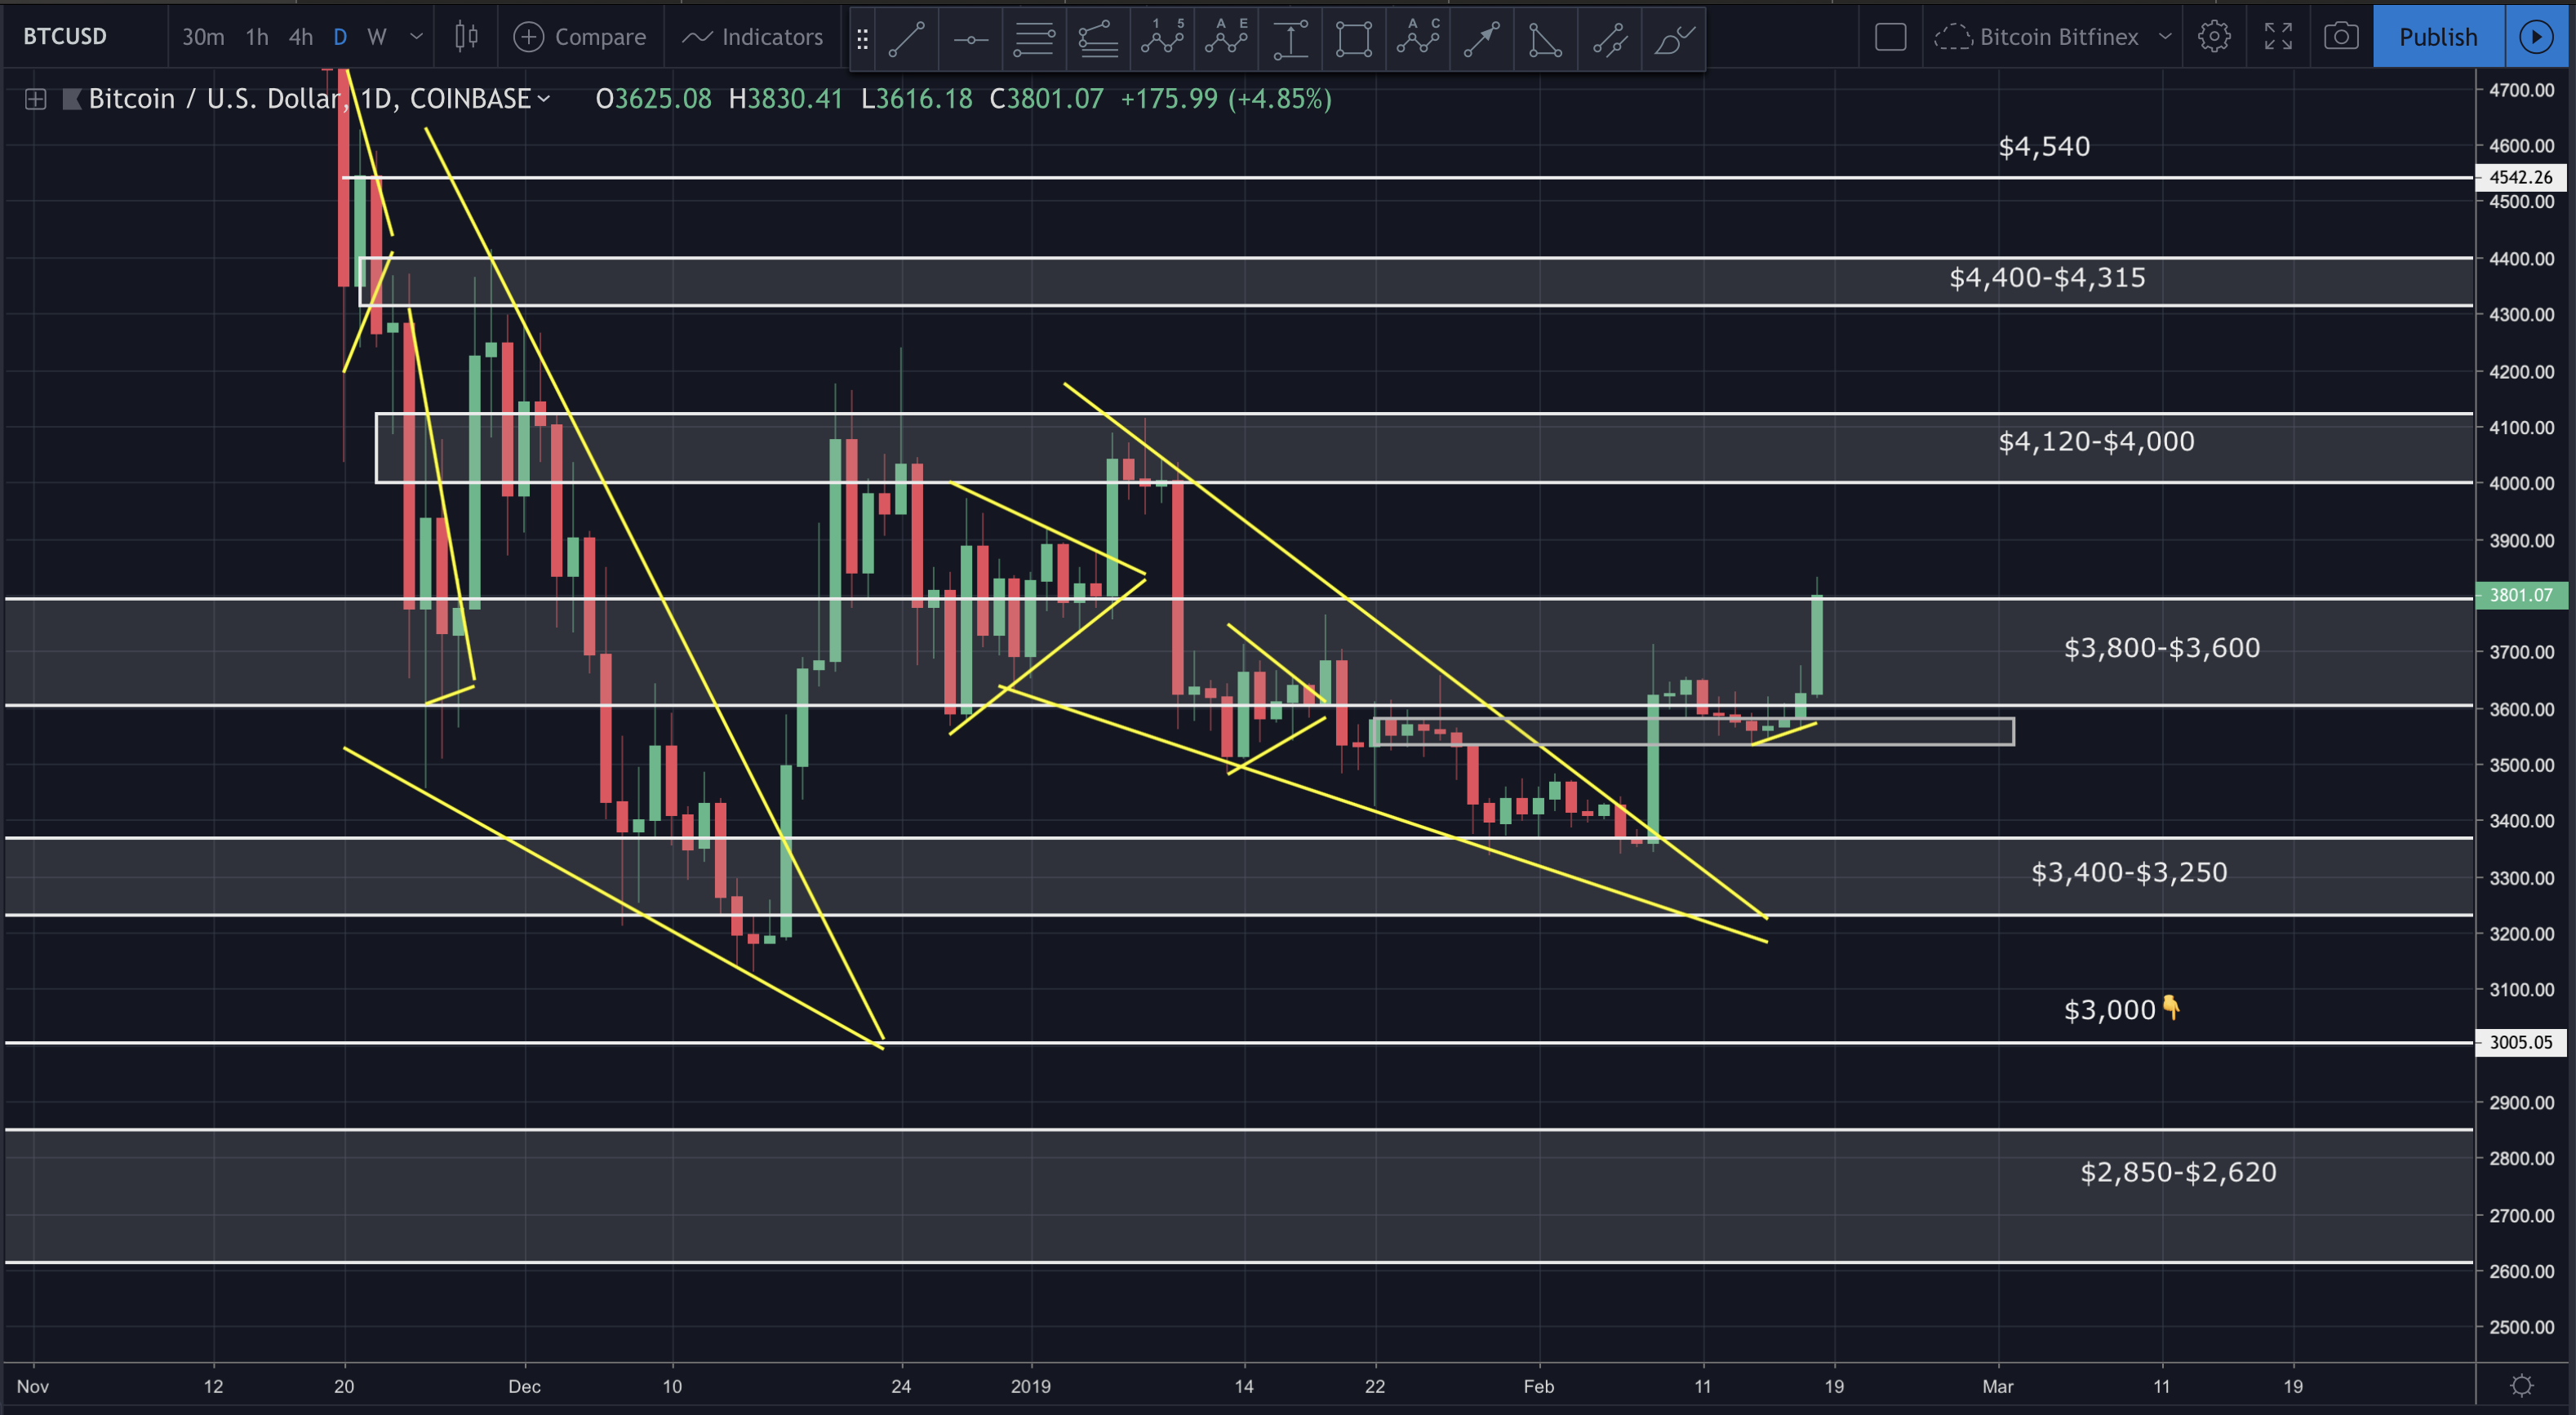
Bitcoin has broken above the $3,600 resistance, and is now testing $3,800. This breakout was backed by a very bullish increase in volume.
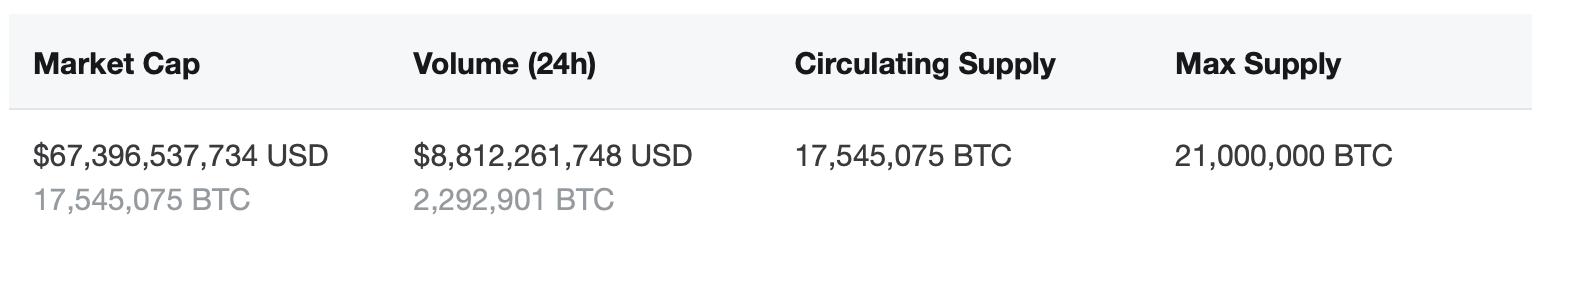
Looking at the daily MACD, we’re seeing some slight bearish divergence. This suggests we could see a pull back. Should that happen, I’d watch for support around $3,700-$3,650.
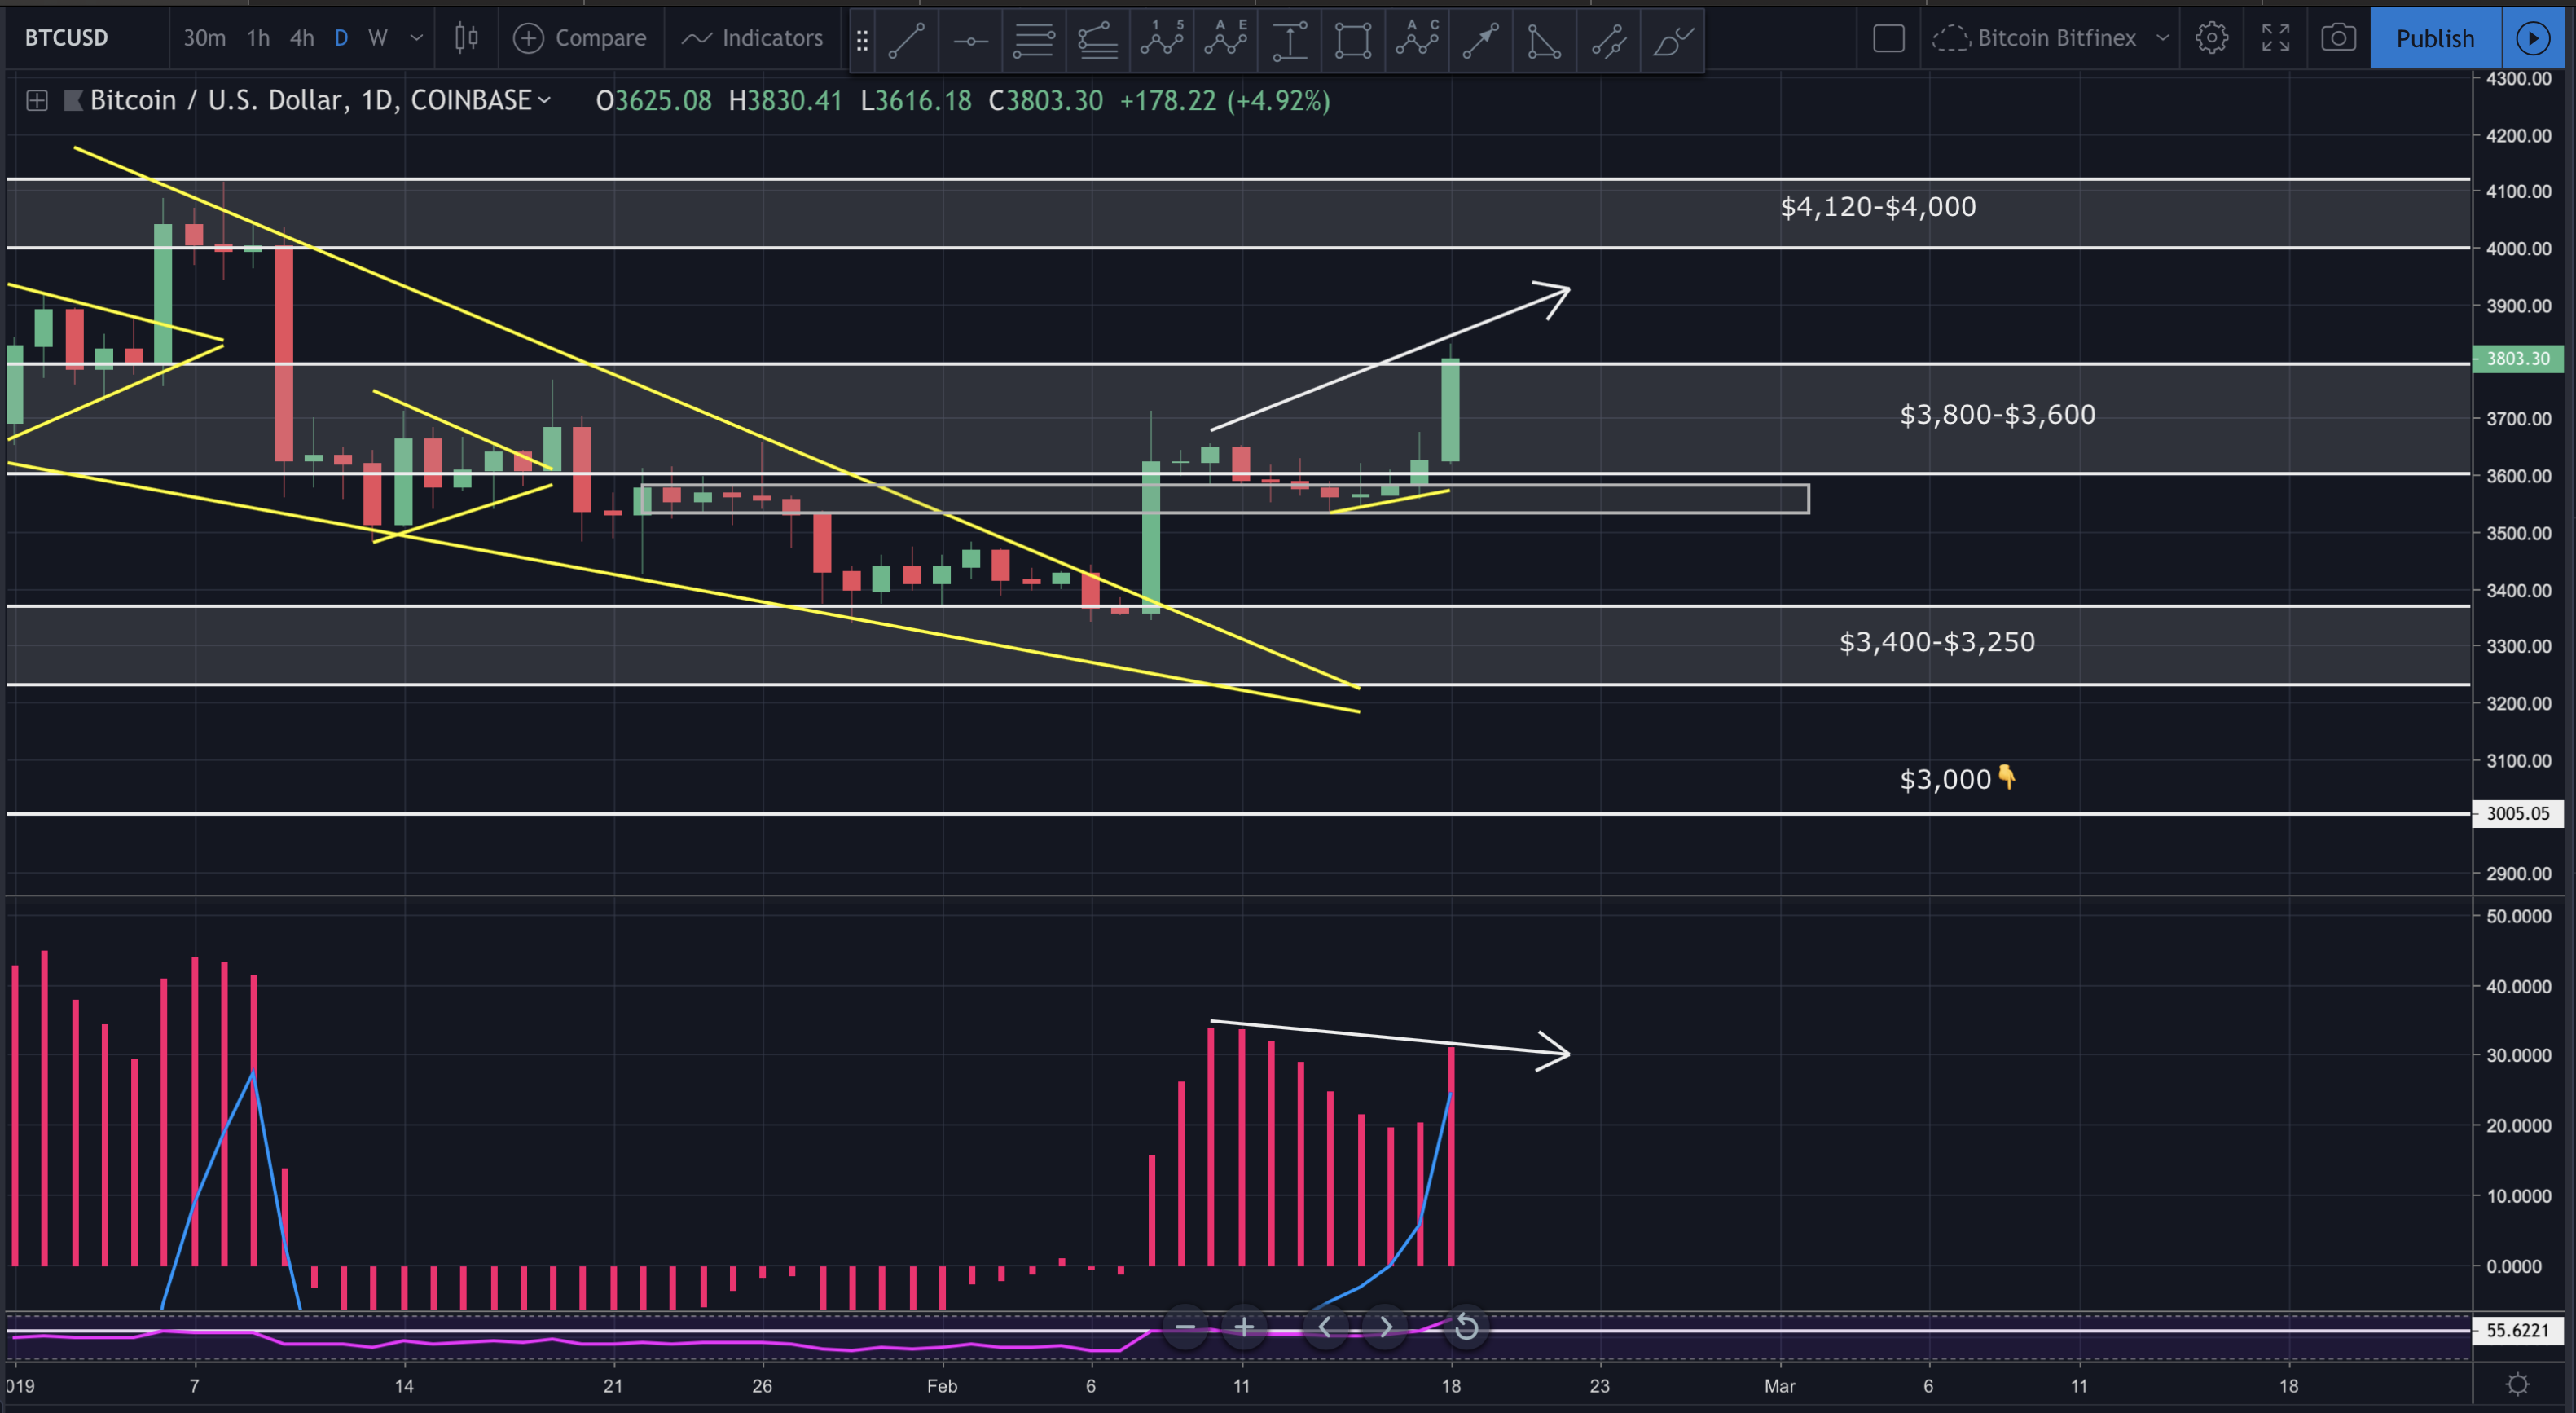
The daily chart also shows price breaking above the 50 day MA. If the daily candle closes above the 50 day MA, it’ll be a good indication this latest breakout has legs…at least temporarily.
Today’s video analysis is a little more in-depth. I discuss market psychology, where price may go next, traps to avoid and so much more. I hope you find it helpful.
Video Analysis:
If you don’t see the above video, navigate to TIMM (https://mentormarket.io/workin/) or Steemit in order to watch.
Get involved!
Comments