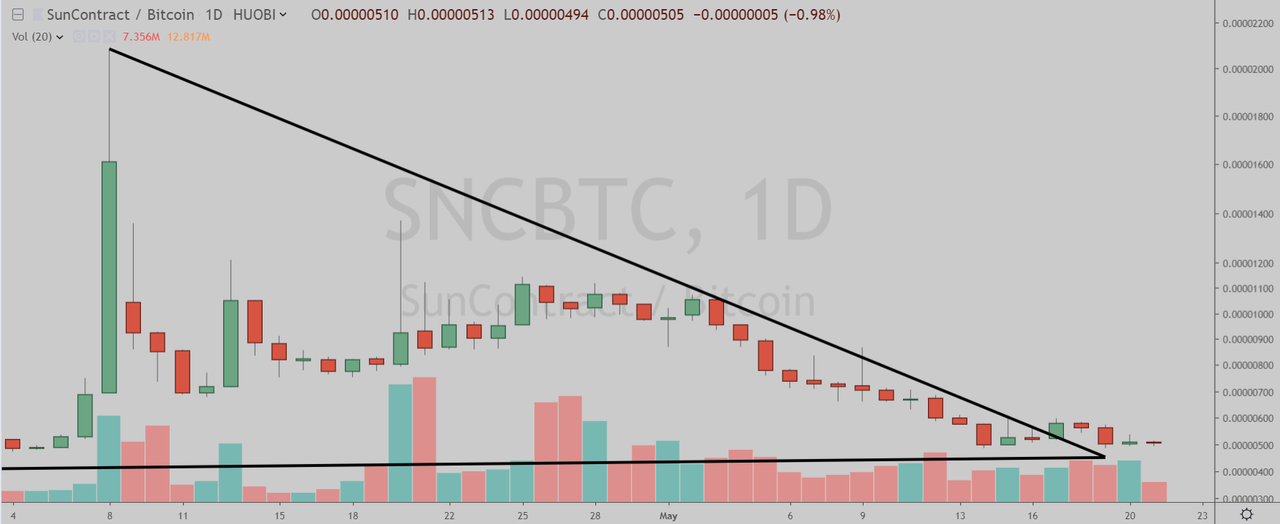
SunContract (Huobi: SNCBTC) has broken out of the triangle pattern in the daily chart.

(Chart courtesy of Tradingview.com (log scale))
Elliott Wave Analysis
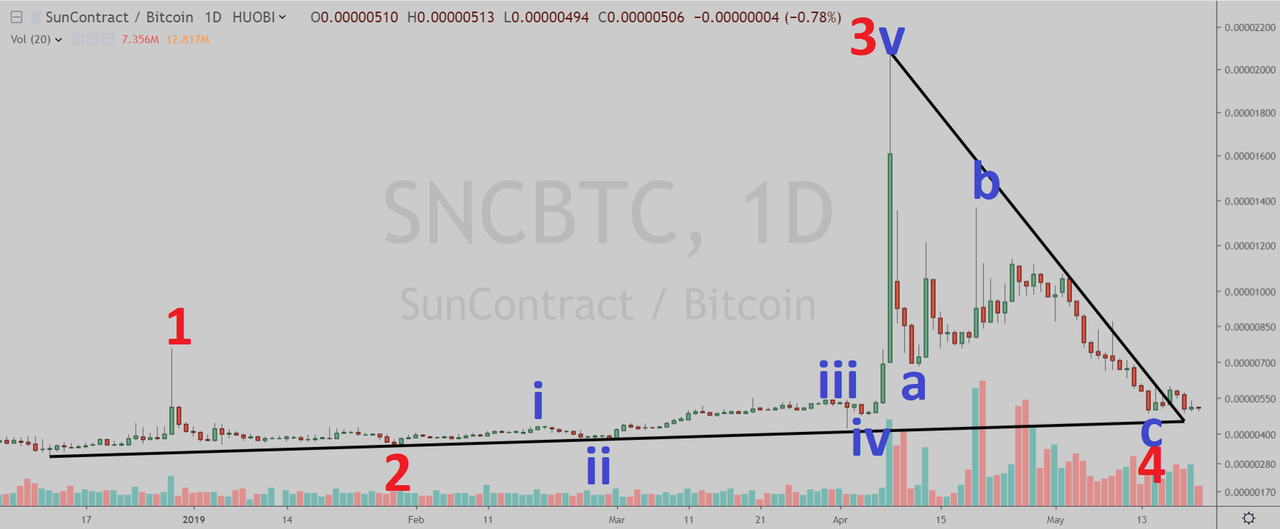
In Elliott Wave terms, SunContract began a wave one leading diagonal advance on December 12, 2018. The red wave one finished on December 29, 2018, and the red wave two correction ended on January 29 this year. The red wave three (blue sub-waves i-ii-iii-iv-v) advance finished on April 8, and the red wave four (blue sub-waves a-b-c) correction ended on May 14. If this wave count is correct, SunContract should be heading next towards the April 8 peak in the red wave five.

(Chart courtesy of Tradingview.com (log scale))
Funnymentals
SunContract is a blockchain based P2P energy marketplace. You can watch their latest AMA below.
(Sources: SunContract and YouTube)

How can I vote? Where is the contest?
You can vote by following this link.


Get involved!
Comments